Woody vegetation rates of clearing 2009–21
Woody vegetation clearing in New South Wales is captured in the Statewide Landcover and Tree Study (SLATS). Woody clearing data has been captured since 1988 and reported since 2006. Data captured over these 30 years is reported as an annualised rate.
For woody and non woody vegetation clearing data from 2018 to 2021, see the 2021 NSW Vegetation Clearing Report.
Figure 1 shows woody vegetation clearing between 2009–21, split into landcover classes.
Figures for woody vegetation clearing in 2021 are reduced compared to previous years. Annual rates remain higher than those recorded prior to the last 6 years.
In this report, plantation and native forestry have been separated to identify known planted and predominantly non-native forests.
The 2021 total clearing rate when plantation forestry is not considered is similar to 2020, with an increase in agricultural clearing, and a slight reduction in native forestry and infrastructure clearing.
All data showing long term trends in woody vegetation rates is available for download.

Figure 1: Total rates of clearing 2009–21
How is woody vegetation clearing captured?
Woody vegetation clearing is detected through automated and manual interpretation of the differences between images captured during the summer of each year. The satellites must have a clear view of the ground and not be impacted by smoke or cloud cover. Satellite images used to assess woody vegetation clearing are selected as close to 1 January each year.
Image interpreters validate the change and assign a replacement landcover class that indicates the change's intended purpose. The broad landcover classes are agriculture, forestry and infrastructure activities.
The Statewide Landcover and Tree Study has captured woody vegetation clearing data since 1988. A range of satellite platforms were used over this period. Earlier platforms had more variable capture times due to lower overpass frequency. For example, Landsat captured the same area every 16 days compared to the Sentinel 2 repeat time of approximately 5 days. Complete satellite coverage of New South Wales requires multiple image captures (footprints). The variable capture time causes variation in the era length between image footprints.
For this reason, clearing figures from 1988 onwards are reported as annualised rates of change for each calendar year (hectares per year). Using a rate allows meaningful comparison between different regional areas by accounting for variation in the capture dates of imagery tiles across New South Wales.
For further information, see Statewide Landcover and Tree Study method.
Rates of woody vegetation clearing by landcover class
Patterns in clearing by landcover class from 2009 to 2021 (Figure 2) show increased clearing for agriculture in 2021 compared to 2020. Clearing for infrastructure is relatively stable between 2017 and 2021, though remains higher than in 2016 and prior. Plantation forestry harvesting has significantly reduced from the peak in 2020, while a smaller reduction can be seen in native forestry harvesting.
Forestry harvesting in state forests is for renewable timber and regrown in perpetuity. Forest re-establishment also usually occurs in other areas subjected to forest harvesting.

Figure 2: Rates of clearing for landcover classes 2009–21
Woody vegetation clearing across New South Wales
The distribution of woody vegetation clearing across New South Wales is shown below.
Plantation forestry harvesting for 2021 (Figure 3) is concentrated along the coast of New South Wales, with higher rates of harvesting predominantly in the south. Native forestry harvesting (Figure 4) is predominantly in the north east of the state.
Agricultural clearing is highest in central New South Wales (Figure 5).
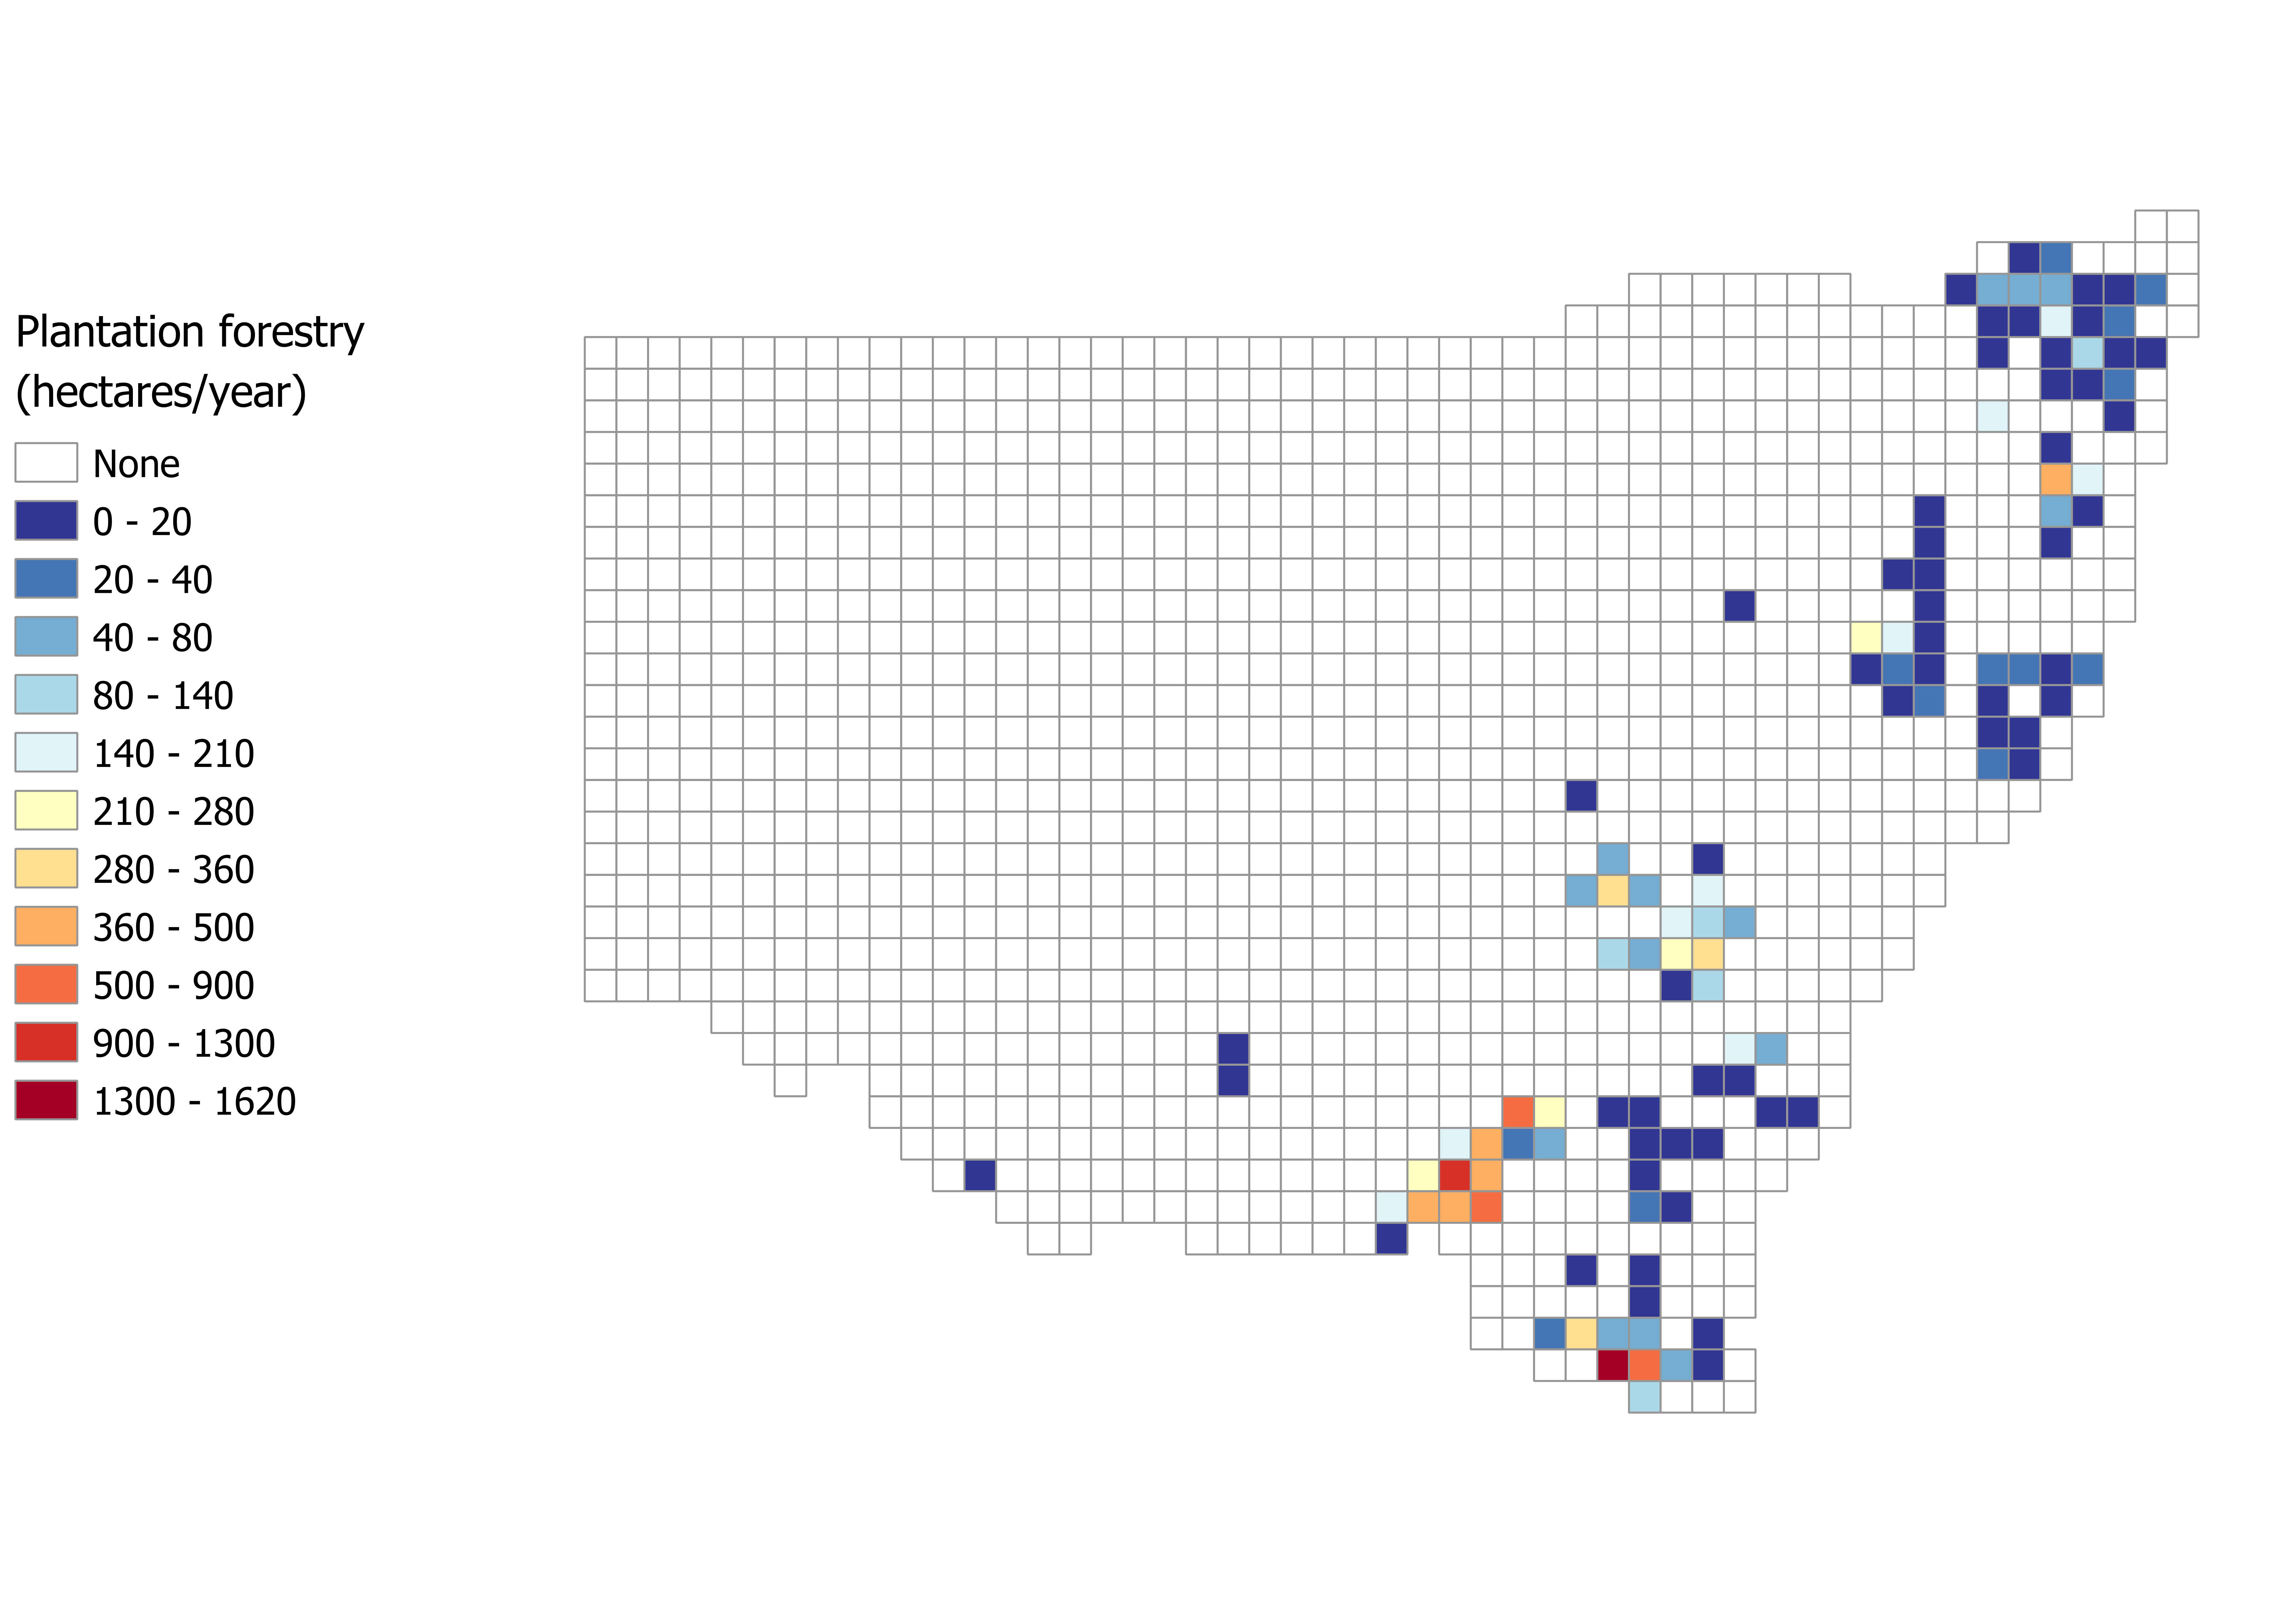
Figure 3: Plantation forestry harvesting across New South Wales
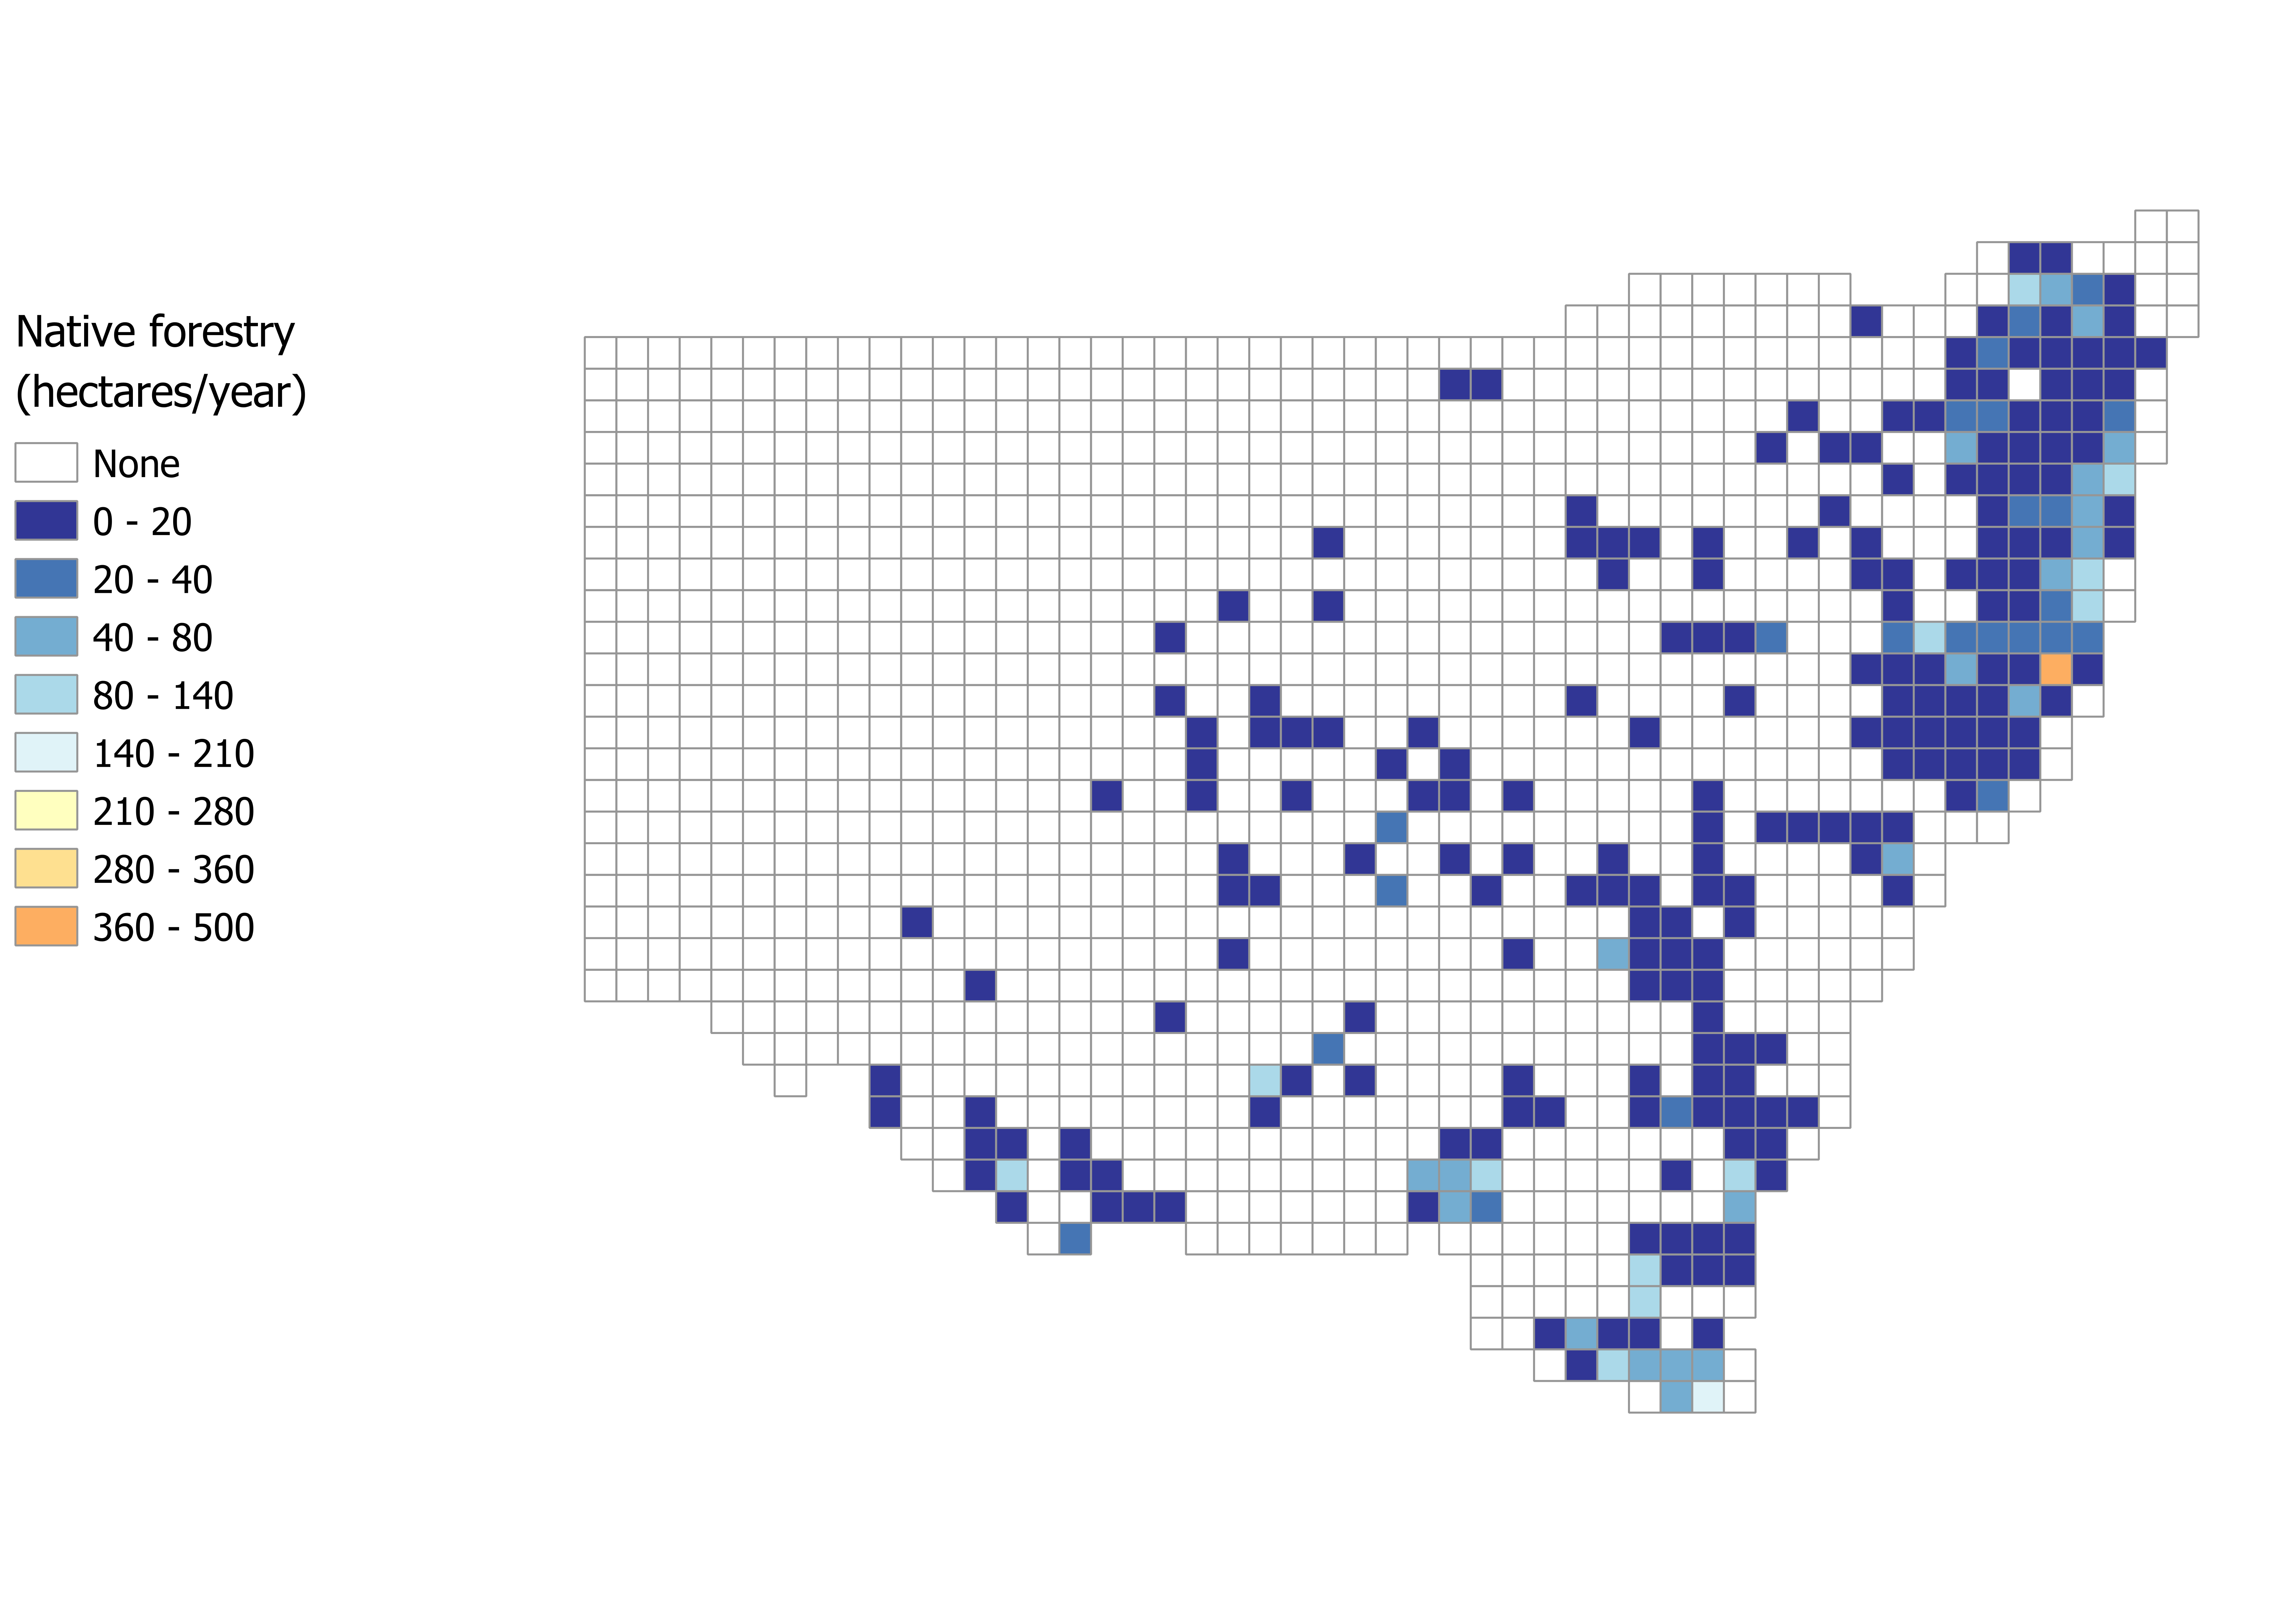
Figure 4: Native forestry harvesting across New South Wales
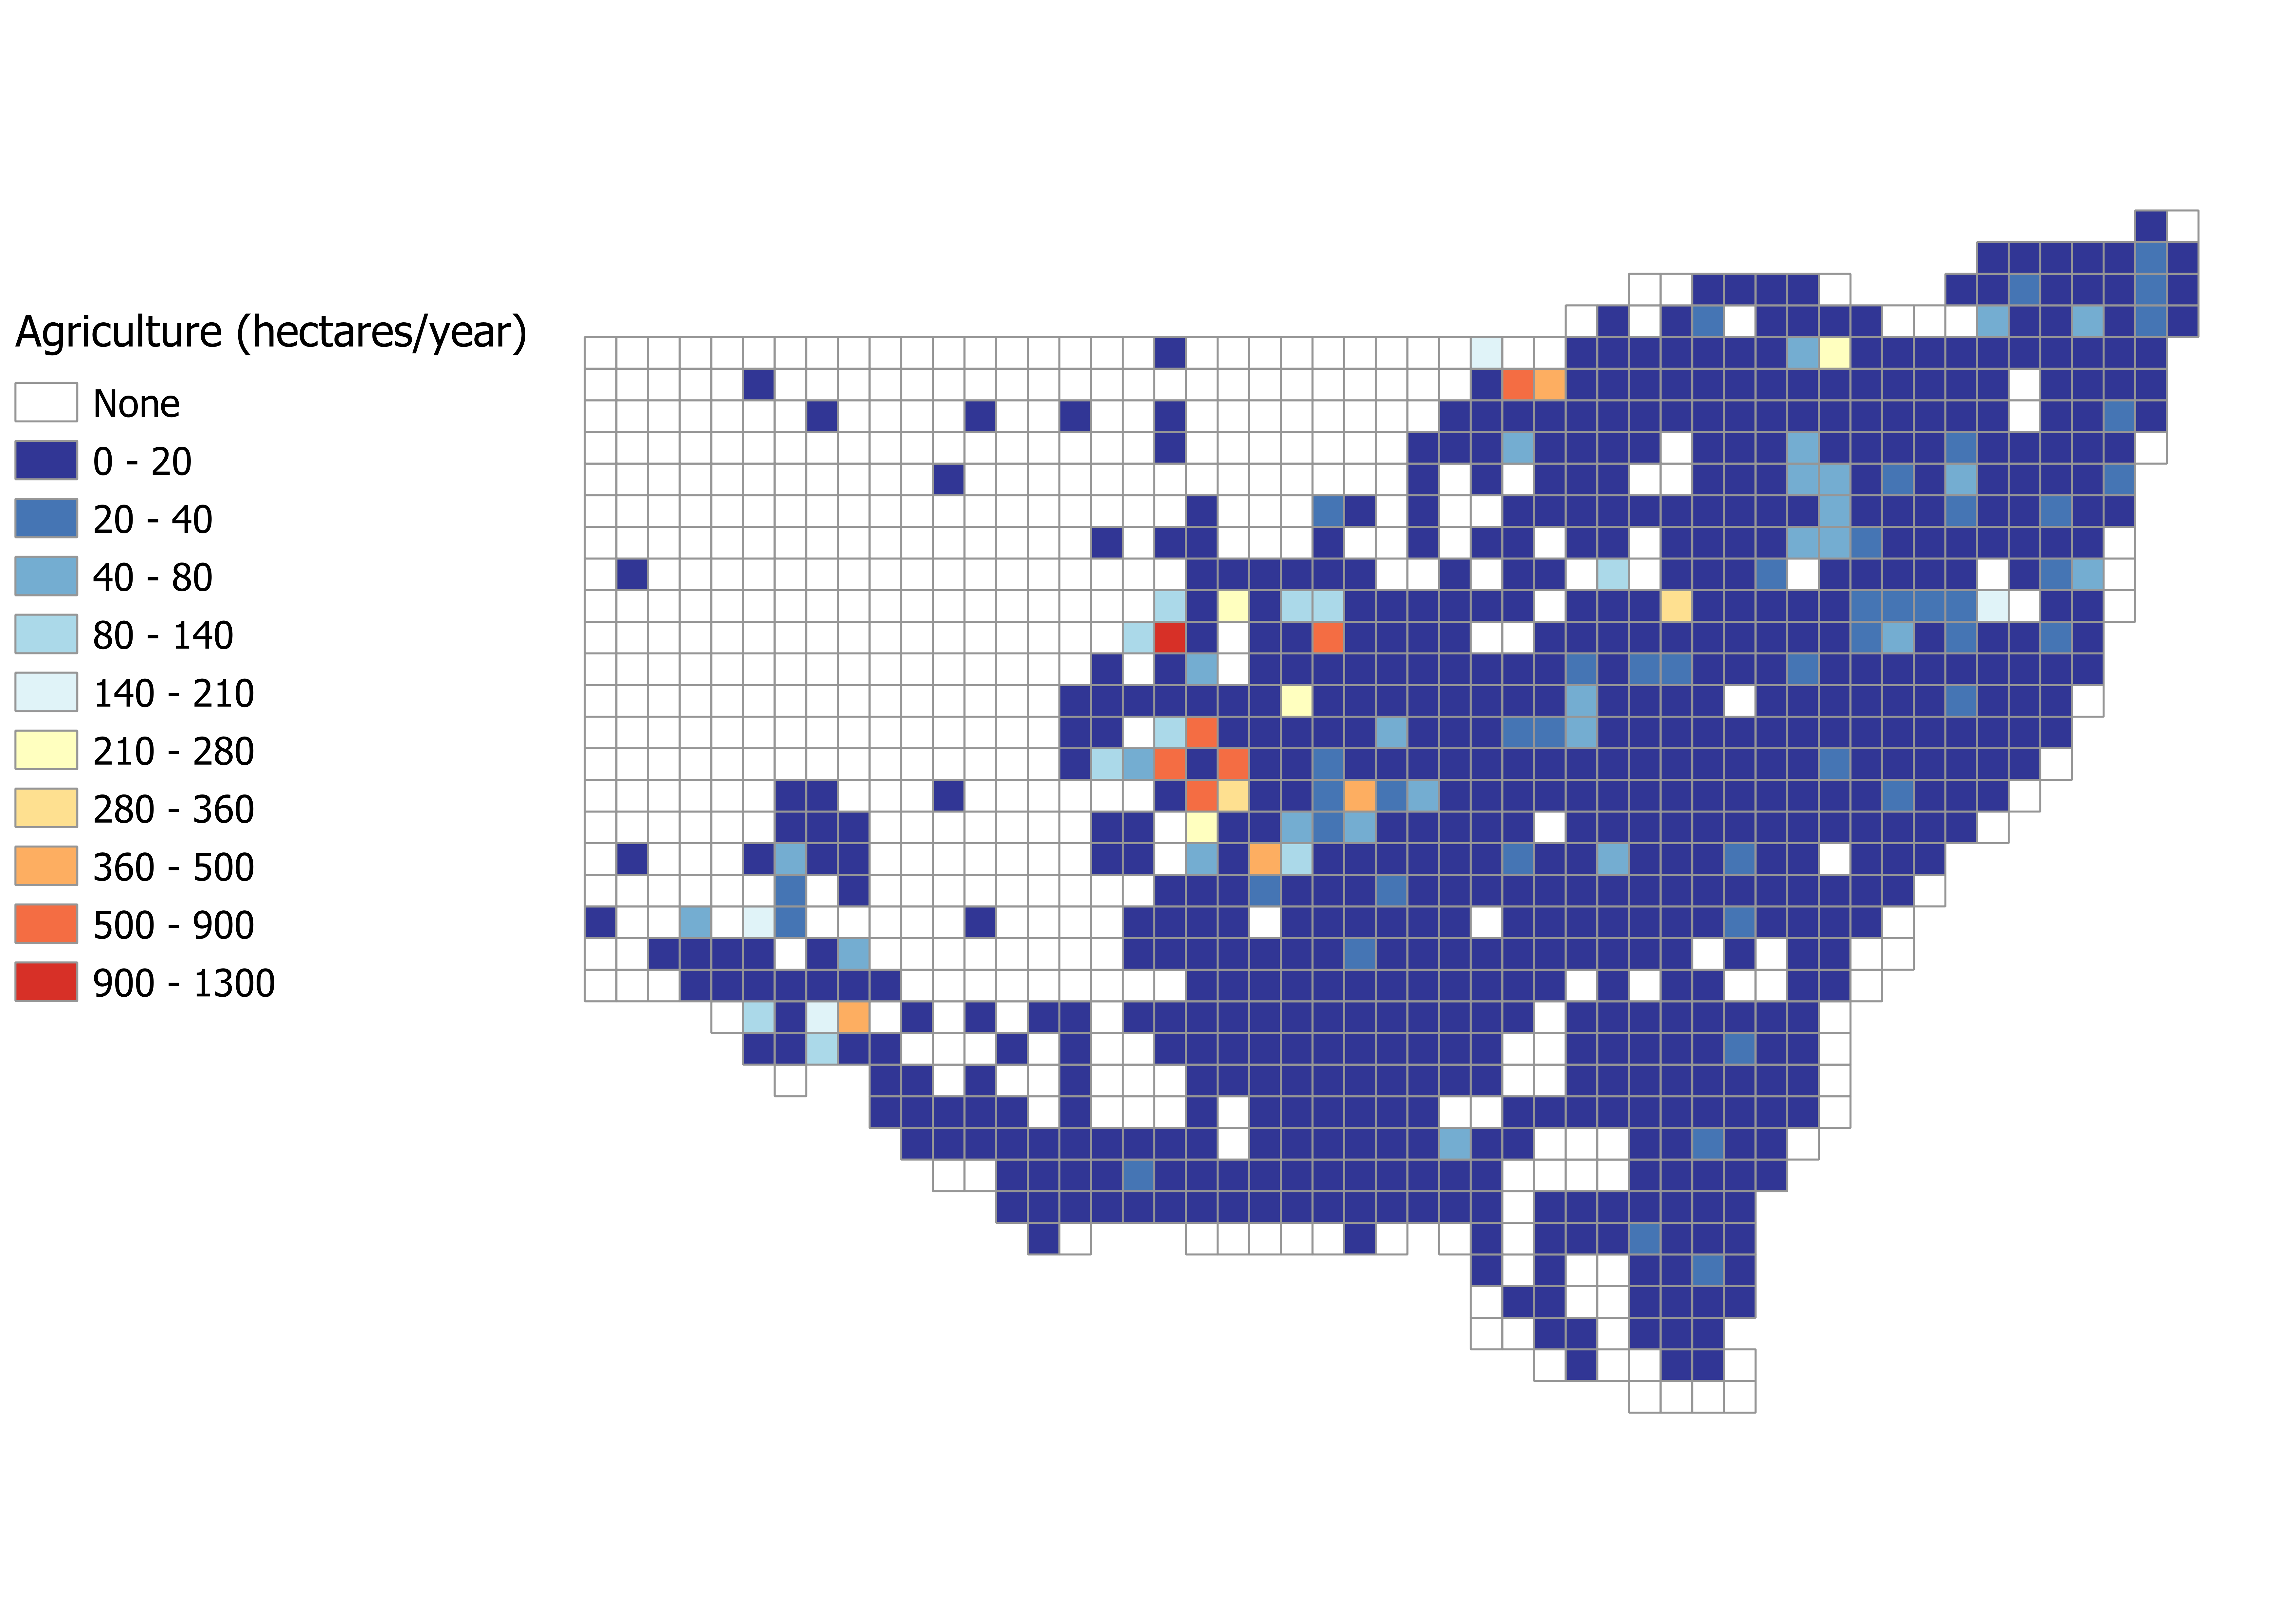
Figure 5: Agricultural clearing across New South Wales