Wapengo Lagoon is located on the far south coast of New South Wales. It is classed as a lake with an open entrance, meaning the estuary is permanently open to the ocean.
Wapengo Lagoon supports a commercial oyster farming industry. The estuary supports both saltmarsh and mangroves.
Water quality report card
As part of our water quality monitoring program we assess the water quality and ecosystem health of an estuary using a range of relevant indicators. We sample a subset of the estuaries between Wollongong and the Victorian border every 3 years. The most recent sampling in Wapengo Lake was completed over the 2021–22 summer, when 2 sites were sampled on a monthly basis.
This report card represents 2 water quality indicators that we routinely measure: the amount of algae present and water clarity. Low levels of these 2 indicators equate with good water quality.
Algae
Water clarity
Overall grade
The report card shows the condition of the estuary was excellent with:
- algae abundance graded excellent (A)
- water clarity graded excellent (A)
- overall estuary health graded excellent (A).
Grades for algae, water clarity and overall are represented as:
- A – excellent
- B – good
- C – fair
- D – poor
- E – very poor.
Go to estuary report cards to find out what each grade means, read our sampling, data analysis and reporting protocols, and find out how we calculate these grades.
We have monitored water quality in Wapengo Lagoon since 2014. This table shows the water quality grades for this estuary over that time.
| Year | Algae | Water clarity | Overall grade |
|---|---|---|---|
| 2014–15 | C | C | C |
| 2018–19 | C | A | B |
| 2019–20 | A | B | A |
| 2020–21 | A | A | A |
Physical characteristics
| Estuary type | Barrier river |
|---|---|
| Latitude (ºS) | –36.63 |
| Longitude (ºE) | 150.02 |
| Catchment area (km2) | 68.5 |
| Estuary area (km2) | 3.7 |
| Estuary volume (ML) | 4070 |
| Average depth (m) | 1.3 |
Notes: km2 = square kilometres; m = metres; ML = megalitres.
Water depth and survey data
Bathymetric and coastal topography data for this estuary are available in our data portal.
Land use
The catchment of Wapengo Lagoon has relatively low disturbance, with almost 80% forested, including a portion of Mimosa Rocks National Park. About 15% of the catchment is used for grazing.
National and marine parks
- Mimosa Rocks National Park is the largest conservation area in the Wapengo Lagoon catchment.
- This estuary does not flow into a marine park.
Citizen science projects
- The Far South Coast Conservation Management Network supports the local community to better manage native biodiversity. The network organises citizen science projects, provides information for private landowners, manages a local plant database, and coordinates events.
Community involvement
- The Bega River and Wetlands Landcare Group is a volunteer group dedicated to improving the health of the Bega River, wetlands and floodplains.
- The Far South Coast Landcare Association is a volunteer environmental and conservation organisation that works to improve management of local land and water.
Seafood harvest area status
The NSW Food Authority website lists the current status of oyster/shellfish harvest areas.
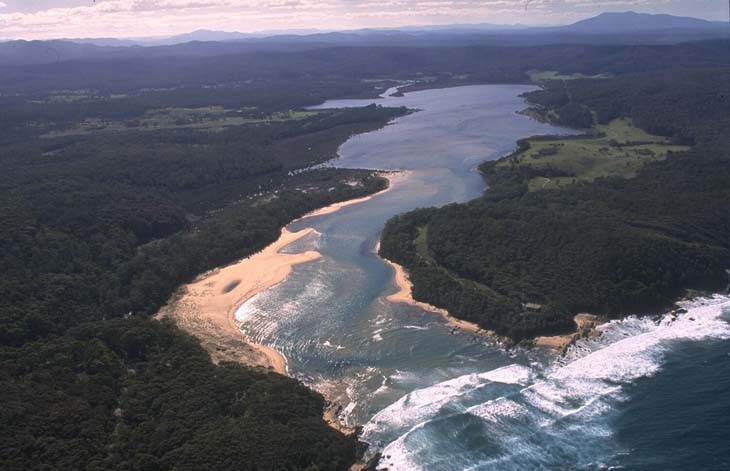
Aerial view of Wapengo Lagoon
Local government management
Local councils manage estuaries within their area unless the estuary is attached to a marine park.
Bega Valley Shire Council manages this estuary.
Threatened species
Wapengo Lagoon supports important saltmarsh and mangrove communities as well as a commercial oyster farming industry.
Read more about the biodiversity in our estuaries.