The air quality summary map below shows the percentage of days that pollutant levels in different metropolitan and regional centres were below air quality standards (dark blue) or over the standards (light blue).
Note: # Merriwa, Aberdeen, Singleton and Muswellbrook are included as Upper Hunter stations.
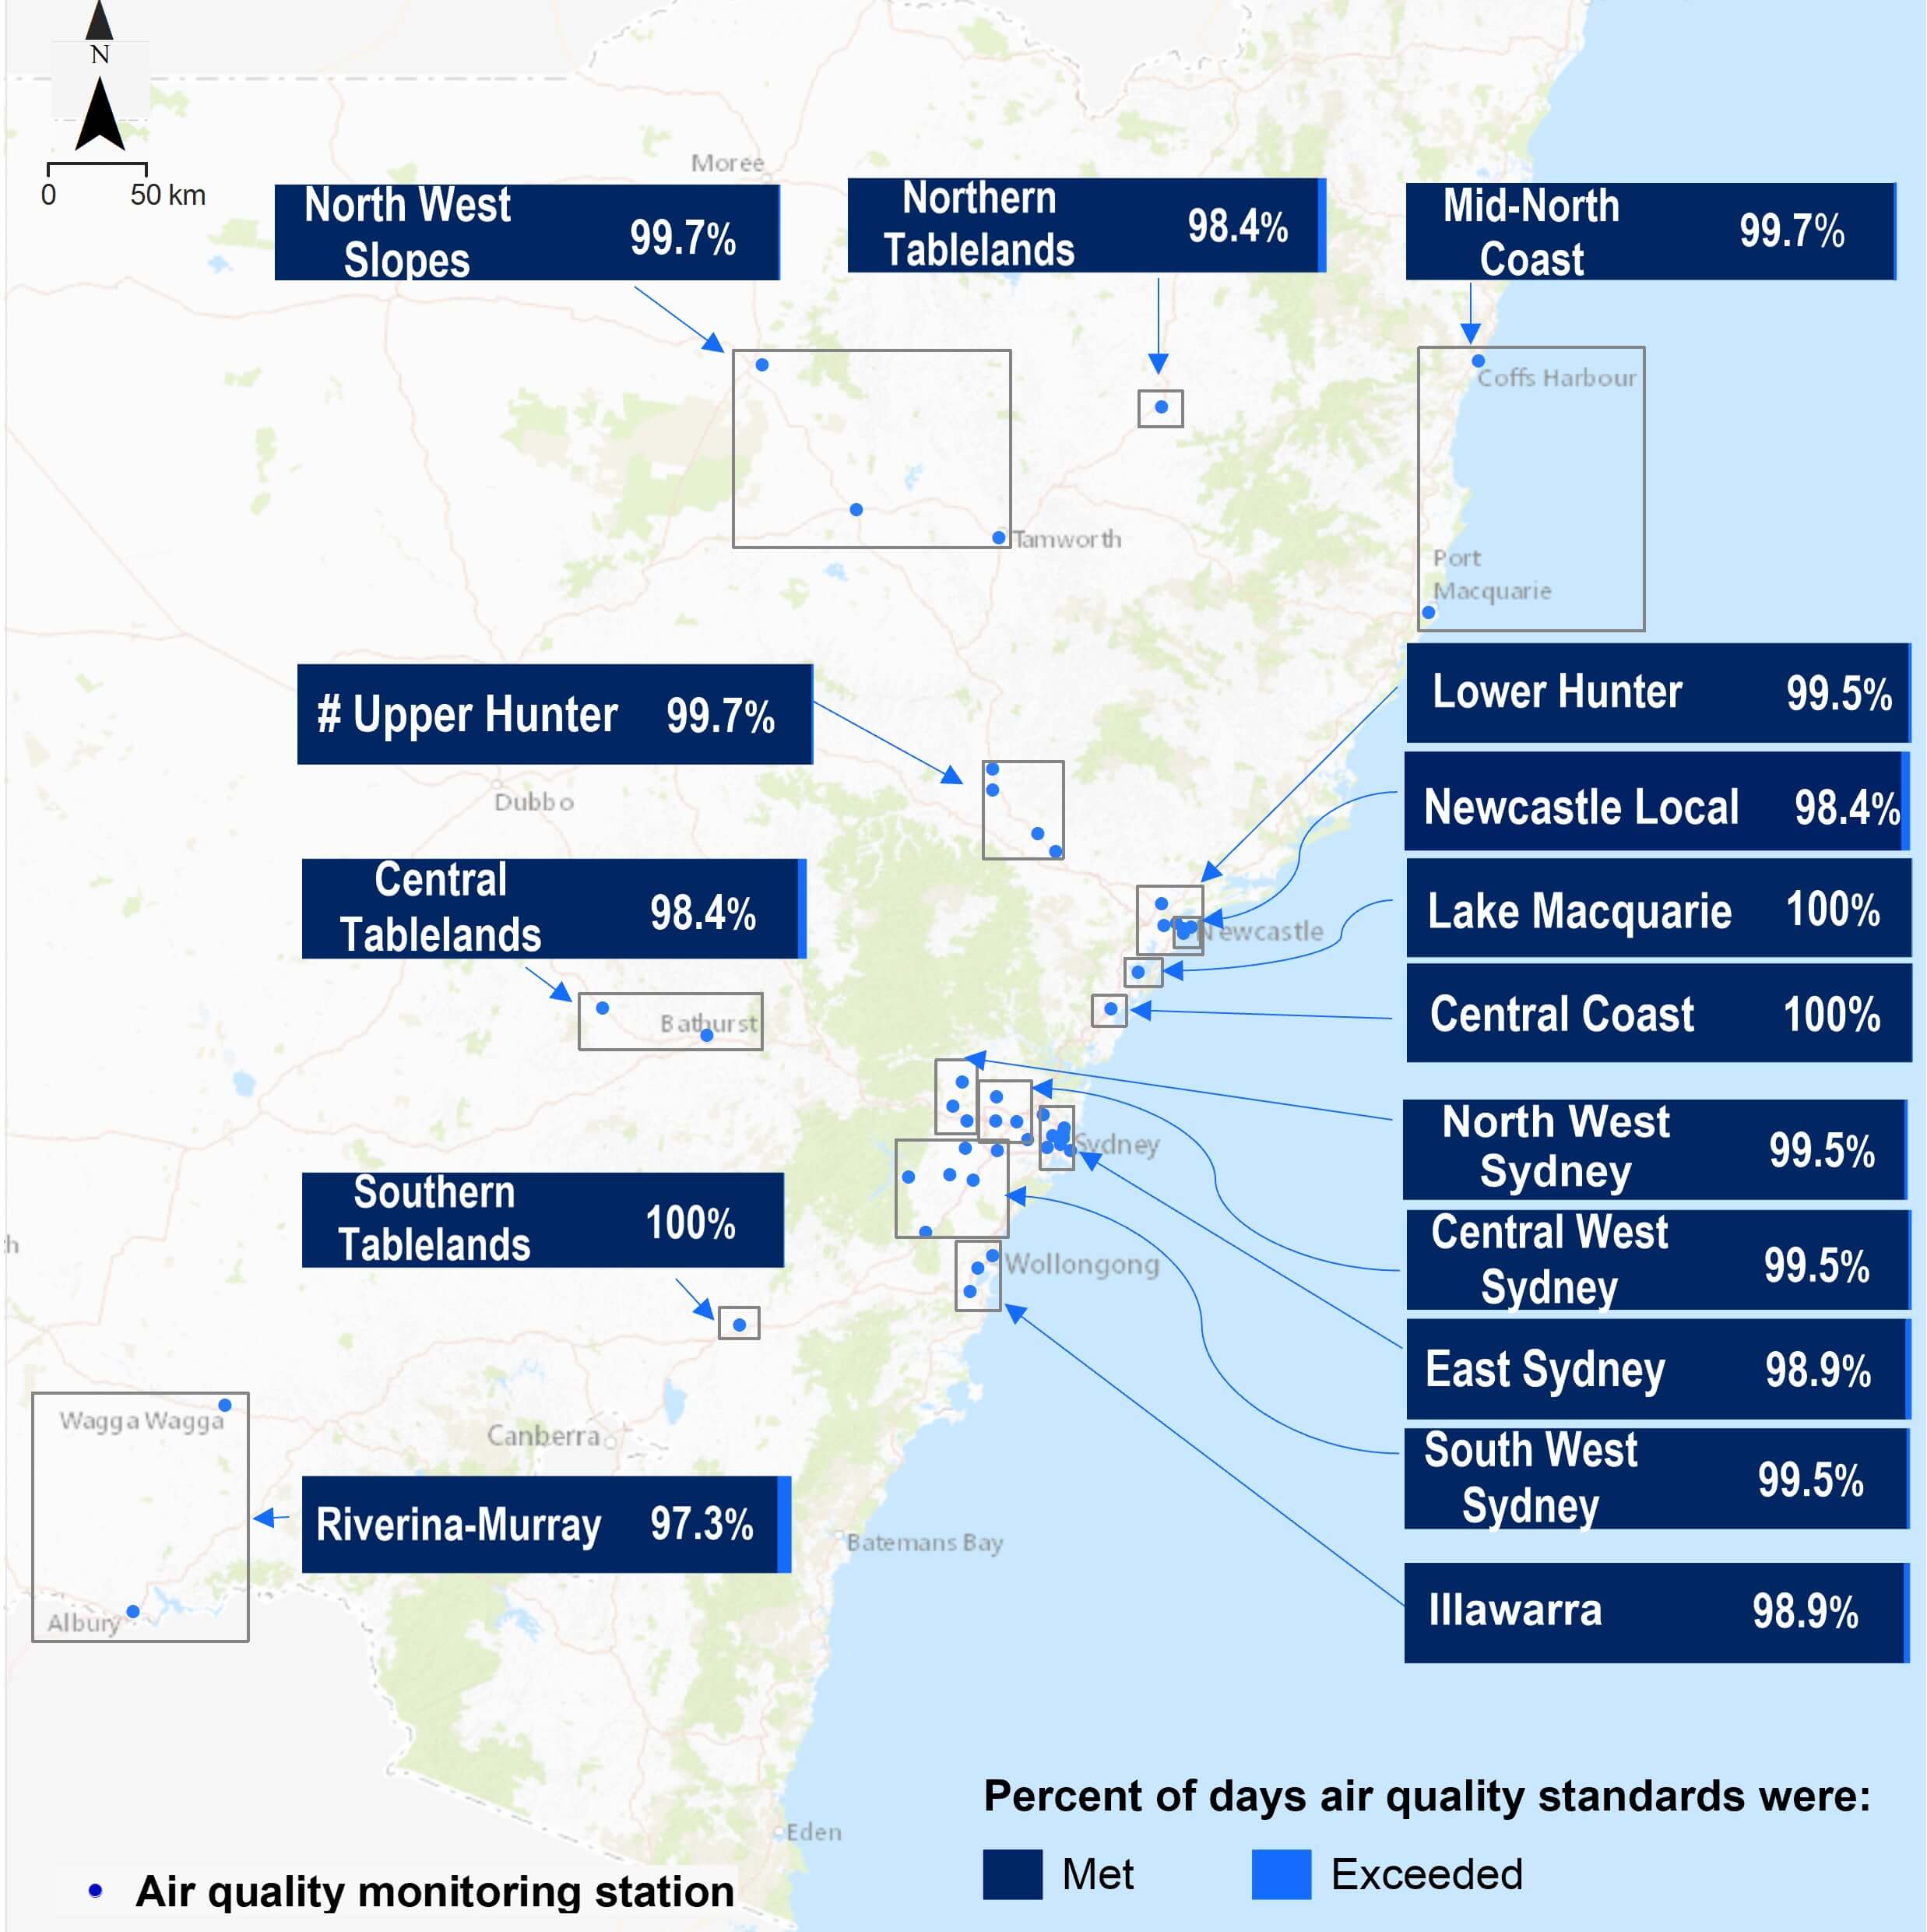
Air quality summary map for NSW regional and metropolitan centres in 2024
Exceedance days
Across the state there were 36 days with one or more air pollutant over a national standard. This was 10 fewer days than in 2023 (see the Days exceeding national standards table below).
Gaseous pollutants met national standards in 2024, except for the 8-hour ozone (O3) standard exceeding on 3 days, similar to 2023.
Particle pollution was the main cause of poor air quality days in 2024:
- The PM10 standard was exceeded on 18 days, compared to 29 days in 2023.
- The PM2.5 standard was exceeded on 20 days, compared to 24 days in 2023.
There were fewer days over the particle standards in 2024 due primarily to wetter conditions and reduced drought, resulting in fewer hazard reduction burns, bushfires and dust events.
Days exceeding national standards at metropolitan and regional centre stations
| Pollutant | Number of days over standard in 2024* | Number of days over standard in 2023* | Percentage of time standards were met in 2024 | Percentage of time standards were met in 2023 |
|---|---|---|---|---|
| Any pollutant exceeded | 36 | 46 | 90.2% | 87.4% |
| Particles as PM10 | 18 | 29 | 95.1% | 92.1% |
| Particles as PM2.5 | 20 | 24 | 94.5% | 93.4% |
| Ozone, O3 | 3 | 3 | 99.0% | 99.0% |
| Sulfur dioxide, SO2 | 0 | 2 | 100% | 99.0% |
| Nitrogen dioxide, NO2 | 0 | 0 | 100% | 100% |
| Carbon monoxide, CO | 0 | 0 | 100% | 100% |
Notes:
* On any given day, levels may exceed standards for multiple pollutants or at one or more air quality monitoring stations. Also note that data is excluded for Stockton station in the Newcastle Local region, and that Upper Hunter stations include Aberdeen, Merriwa, Muswellbrook, and Singleton.
Exceedance causes
The Source attribution for event days graph at the bottom of this page shows sources identified as contributing to exceedances of PM10, PM2.5 and ozone air quality standards in each region.
Dust, wood heater smoke and hazard reduction burns accounted for most exceedances of particle national standards.
Ozone
In 2024, the ozone national standard was exceeded on 3 days at 10 stations across 4 regions.
- Newcastle and Wallsend in the Lower Hunter exceeded the standard during a summer heatwave on 25 January.
- Camden and Campbelltown West in South West Sydney exceeded the standard during a late-spring heatwave on 26 November.
- The most extensive event was on 13 December when 6 stations located across 3 Sydney regions exceeded the standard during heatwave conditions. These stations were Earlwood, Lidcombe, Liverpool, Macquarie Park, Parramatta North and Prospect.
By comparison, there were 3 ozone exceedance days in 2023, at 11 stations located across 5 regions, including all 4 Sydney regions and the Illawarra.
Particles
The 13 regions below experienced at least one day in 2024 when either one or both PM10 or PM2.5 standards were exceeded. There were no exceedances in the Lake Macquarie, Central Coast and Southern Tablelands regions.
- East Sydney: 3 days at Macquarie Park, all due to spring hazard reduction burning elevating PM2.5 particles.
- North West Sydney: 2 days at Richmond, both due to elevated PM2.5 particles. One day in autumn and one day in spring due to hazard reduction burning.
- Central West Sydney: 1 day in late autumn at Parramatta North due to woodsmoke elevating PM2.5 particles.
- South West Sydney: 1 day in early summer at Bringelly due to dust-raising activity elevating PM10 particles.
- Illawarra: 4 days due to dust elevating PM10 particles at Kembla Grange (3 days) and Wollongong station (1 day).
- Newcastle Local: 6 days across the region due to elevated PM10 levels (at Mayfield and Carrington). Five days during January to March, due either to local dust, or sea salt or the combined influence of sea salt and industry. One exceedance day in September was due to combined influence of dust and hazard reduction burning.
- Lower Hunter: 1 day at Beresfield due to spring hazard reduction burning elevating PM2.5 particles.
- Upper Hunter: 1 day in February at Singleton due to a regional scale dust event elevating PM10 particles.
- Northern Tablelands: 6 days at Armidale due to winter wood-heater smoke elevating PM2.5 particles.
- North West Slopes: 1 day at Gunnedah, due to winter wood-heater smoke elevating PM2.5 particles.
- Mid North Coast: 1 day at Port Macquarie due to a bushfire in January elevating both PM10 and PM2.5 particles.
- Central Tablelands: 5 days at Orange, due to winter wood heater smoke elevating PM2.5 particles.
- Riverina-Murray: 10 days across the region. At Albury: hazard reduction burning in April increased PM2.5 particles on 3 days and PM10 particles on one of those days, and dust raised PM10 particles on 1 day in November. At Wagga Wagga North: from March to May, PM10 particles were elevated due to local dust (3 days), and a mix of dust and agricultural burning (2 days). In December, local dust raised PM10 particles on 1 day.
Source attribution for event days graph
The graph shows the cause for exceedances of the PM10, PM2.5 and ozone (O3) standards across New South Wales in 2024.
- On any given day, levels may have been over the standard for multiple pollutants at one or more air quality monitoring stations.
- * Represents exceptional event days, that is, pollutant levels on these days were adversely affected by bushfires, or jurisdiction authorised hazard reduction burns in 2024.
- ~ ‘Mix dust and burning’ represents the combined influences of dust with either jurisdiction authorised burning or agricultural burning. The event will be classified as exceptional for the first case.
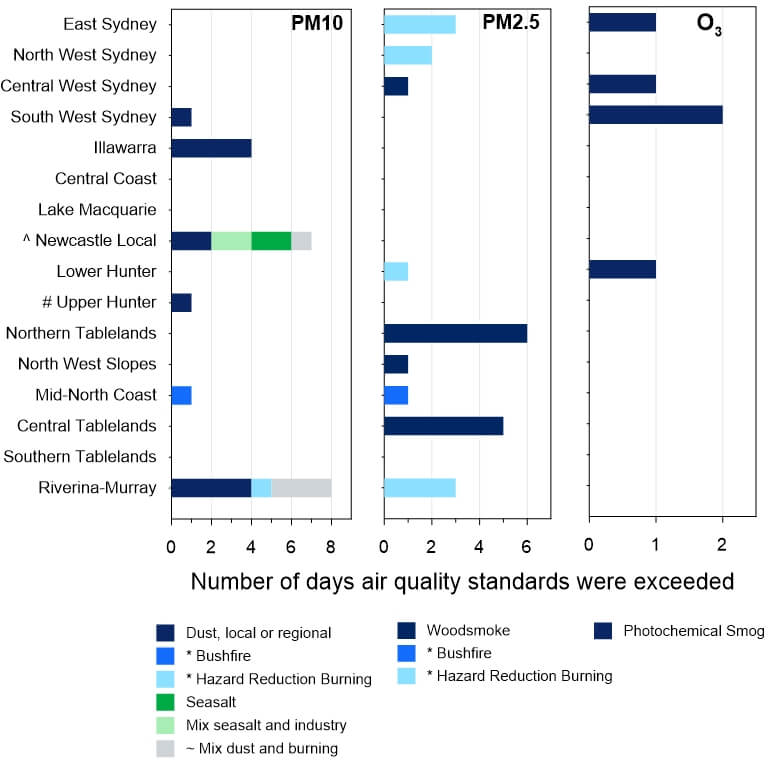
Source attribution graph showing event causes for pollutants exceeding national standards in 2024