The main aim of the Statewide Landcover and Tree Study (SLATS) Program is to map the location and extent of vegetation clearing each year. This information is then provided to land managers and policy makers for monitoring and reporting.
Woody vegetation as defined for the Statewide Landcover and Tree Study:
- produces wood as its primary structural tissue
- is typically trees, shrubs or woody vines (lianas)
- is usually perennial.
The Statewide Landcover and Tree Study method was adopted in 2006 to detect woody vegetation clearing after being developed and implemented in Queensland by the Department of Environment and Science. New South Wales adapted the method to suit current imagery availability and to meet reporting requirements and applications. Information is available on the Statewide Landcover and Tree Study method to detect non woody vegetation.
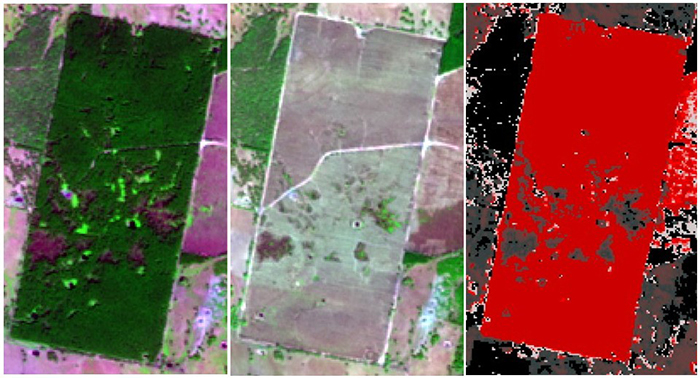
Satellite imagery showing woody vegetation prior to a clearing event (left), satellite image showing cleared vegetation (middle) and a change probability raster showing areas with a high probability of clearing in red (right).
How we detect vegetation change
We use a combination of automated and manual mapping techniques to monitor woody vegetation loss.
The SLATS method is based on imagery from the European Space Agency’s Sentinel-2A and Sentinel-2B satellites that capture high-resolution images of the Earth’s surface every 5 days. A statewide raster layer is produced that indicates where woody vegetation has been cleared each year. A raster layer is made up of grid or matrix of cells, also called pixels. In previous years this has been further processed for distribution as a point vector layer.
The satellites that have captured the imagery used in the SLATS program have changed over the years in response to changing technologies. Previously Landsat 5 and,7 and SPOT5 satellite sources were used. We currently use Sentinel satellite sources.
Results are assigned to a replacement landcover class, to indicate the purpose for which the vegetation was cleared. Assignment of these classes is primarily based on visual interpretation of the location and the pattern of the clearing with reference to supporting data sources such as tenure.
Source imagery specifications over time
This table provides summary information on the frequency and satellite data specifications for monitoring woody vegetation clearing since 1988.
| Years | Frequency | Satellite | Pixel size (metres) |
|---|---|---|---|
| 1988–2006 | Every 2 years | Landsat | 25 |
| 2006–2008 | Annual | Landsat | 25 |
| 2008–2010 | Annual | Landsat | 30 |
| 2008–2015 | Annual | SPOT5 | 5 |
| 2015–2017 | Annual | SPOT 5 (2015) > Sentinel-2 (2017), split by SPOT 6/7 (2016) for viewing only | 5 |
| 2017 onwards | Annual | Sentinel-2 | 10 |
Method
Method summary
Cloud-free satellite images are selected in mid-summer, ideally a year apart. The images are processed before comparison to reduce shift and distortion associated with satellite capture. Analysis of the images then involves:
- application of an automated change detection algorithm to the 2 images, resulting in a change probability raster
- comprehensive human visual interpretation of areas detected with a high probability of change
- verification of the change detection by expert analysts against the pre- and post-change imagery
- peer review of each scene, or image, before final processing.
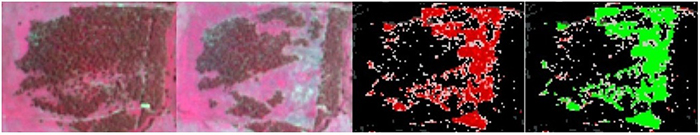
Detection of woody vegetation change using satellite imagery
The images above show (from left to right):
- the area in 2018 prior to vegetation clearing
- the area in 2019 after vegetation clearing
- a probability raster showing high probability clearing in red – the darker the red, the higher the probability of clearing
- a probability raster that has been verified identifying agricultural clearing as green.
The SLATS Program enables woody vegetation clearing to be categorised by assigning a replacement landcover class that indicates the likely purpose for which the vegetation was cleared.
Workflow diagram and description
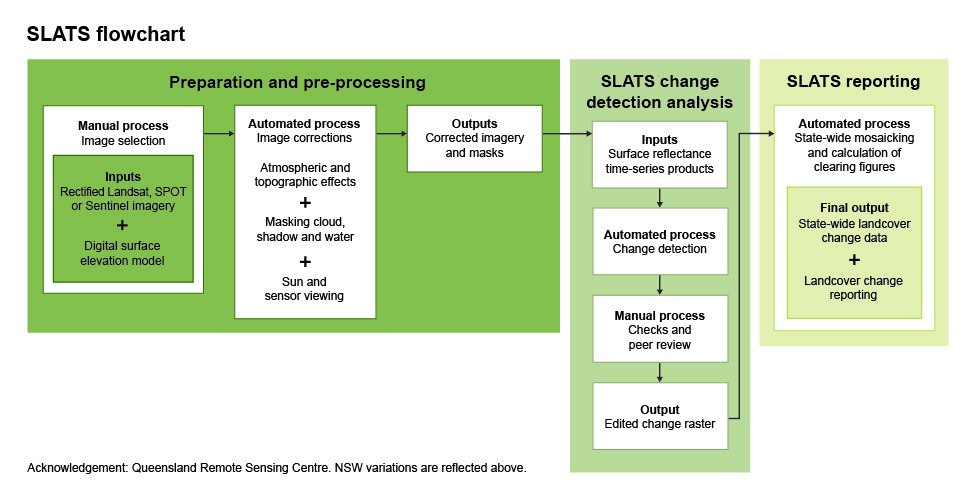
SLATS NSW variations flowchart
Select image
Satellite images are selected as close as possible to 1 January each year and must have a clear view of the ground not impacted by smoke or cloud cover.
This requirement can result in a range of imagery dates being selected each year. For example, the 109 Sentinel-2 images for 2019 ranged from November 2018 to late January 2019. For this reason, the resulting clearing figures are reported as annualised rates of change for each calendar year (2018–19).
Images are checked for geographic (spatial) accuracy and quality. If needed, images are linear shifted or a different image is selected.
Georectification is the digital alignment of a satellite or aerial image with a physical location on the ground. Visit the GIS Dictionary on the ESRI website for more information.
Radiometric corrections
This step adjusts pixel values to accommodate for atmospheric variations and reflectance differences. This creates a final image that most clearly represents the features on the Earth’s surface for detecting change. Examples of atmospheric variations include atmospheric haze and optical depth. Reflectance differences relate to the solar angles at different times of year (summer/winter).
Masking
A variety of masks are created to exclude some areas from the woody change analysis. These include masks for cloud, shadow and water. The cloud and cloud-shadow masks are generated automatically and then manually edited.
Change detection algorithm
Corresponding pixels in each calibrated ‘before’ and ‘after’ image are compared through an automated process which calculates a probability index of woody clearing. This probability raster for each image shows, for each pixel, the likelihood of the woody vegetation having been cleared. Higher probability is allocated to the most obvious change in woody vegetation.
Manual editing
The probability raster that is created is edited by image interpretation experts and checked in a peer-review process. Areas that are recognised by an editor as clearing are assigned a replacement landcover class, to indicate the purpose for which the vegetation was cleared. The assignment of these classes is primarily based on visual interpretation of the context of the identified clearing event with reference to ancillary data sources. In areas where there are many different forms of land use, it can be difficult to interpret the final landcover class and therefore this classification is indicative only.
Final processing
The edited probability rasters go through a series of automated checks and are then ‘stitched together’ to form a mosaic of New South Wales to be used for analysis and reporting.
Landcover classes
Results are assigned to a replacement landcover class that provides an indication of the purpose for which the vegetation was cleared. The landcover classes are:
- agriculture, such as clearing for grazing, cropping or horticulture
- infrastructure, such as residential, commercial, mining, public infrastructure and farm infrastructure
- forestry, such as native and plantation harvesting, establishment, thinning, forestry infrastructure
- natural processes, such as fire, landslide, storm, dieback.
References and acknowledgements
Queensland Department of Environment and Science 2018, Statewide Landcover and Trees Study (SLATS): Overview of Methods, Qld DES, Brisbane.
Thanks to these organisations:
- Queensland Government Remote Sensing Centre
- Sentinel data courtesy of the European Space Agency
- National Computational Infrastructure
- Staff from the Joint Remote Sensing Research Program.
Products
Current and historical SLATS data is made available through the Sharing and Enabling Environmental Data portal after any compliance investigations have been completed. The resulting statistical analysis is released annually. The resulting statistical analysis is released annually and reports are available from the Non woody landcover disturbance method page.
Historical data is currently delivered in a vector format. From 2015, data has been delivered as a statewide raster (pixel) product in GeoTiff format. The product indicates where woody vegetation clearing has occurred throughout New South Wales.
Collection of geospatial data
Remotely sensed imagery is routinely collected by the Department of Climate Change, Energy, the Environment and Water and used to map vegetation clearing. This data is spatially explicit and can be used with other datasets to identify activity on individual lots. Please read the Privacy collection notice (PDF 50KB) for more information.
Data access
How results are used
Results for the SLATS Program are used in several ways, including but not limited to: