In 2024:
- Nine stations exceeded the PM10 daily standard, with exceedances observed on 18 days. This was an improvement compared to 2023 when 21 stations exceeded the standard, and there were 29 exceedance days.
- Nine stations exceeded the PM2.5 daily standard, with exceedances observed on 20 days. This was also an improvement compared to 2023, when 27 stations exceeded the standard, and there were 24 exceedance days.
- Air quality was extremely poor (at least twice the national standard) at one station on one day (Richmond, 4 September), due to PM2.5 particles. This compares to 5 days in 2023 when 10 stations experienced extremely poor air quality, all due to PM2.5 particles.
- All stations in metropolitan and regional centres met particle annual standards except for Bradfield Highway roadside station exceeding the PM2.5 annual standard.
PM10 particles
- Daily average national standard – 50 micrograms per cubic metre of air (50 µg/m3).
- Annual average national standard – 25 micrograms per cubic metre of air (25 µg/m3).
Nine stations exceeded the PM10 daily standard in 2024 (see the PM10 summary graph below), an improvement compared to 21 stations in 2023.
The maximum daily PM10 level (75.6 µg/m3) was observed on 28 August in the Illawarra at Kembla Grange.
Two stations exceeded the PM10 daily standard most frequently. These were Wagga Wagga North in Riverina-Murray (6 days) and Mayfield in Newcastle Local (5 days). At Mayfield, most events (4 days) occurred from January to March. At Wagga Wagga North, most events occurred in autumn (5 days).
Annual average PM10 levels remained below the 25 µg/m³ standard at all stations. The highest annual average in 2024 was 22.5 µg/m3, observed at Carrington in Newcastle Local.
PM10 daily and annual summary
The graph below summarises PM10 measurements at NSW metropolitan and regional population centres. It shows for PM10, the maximum daily average for each station, the station annual average, and total count of event days.
Days exceeding standard are divided into exceptional and non-exceptional events. Exceptional events are those related to bushfires, hazard reduction burns and continental-scale dust storms. These are not counted towards the NEPM (National Environment Protection Measures) goal of 'no days exceeding the particle standards in a year.'
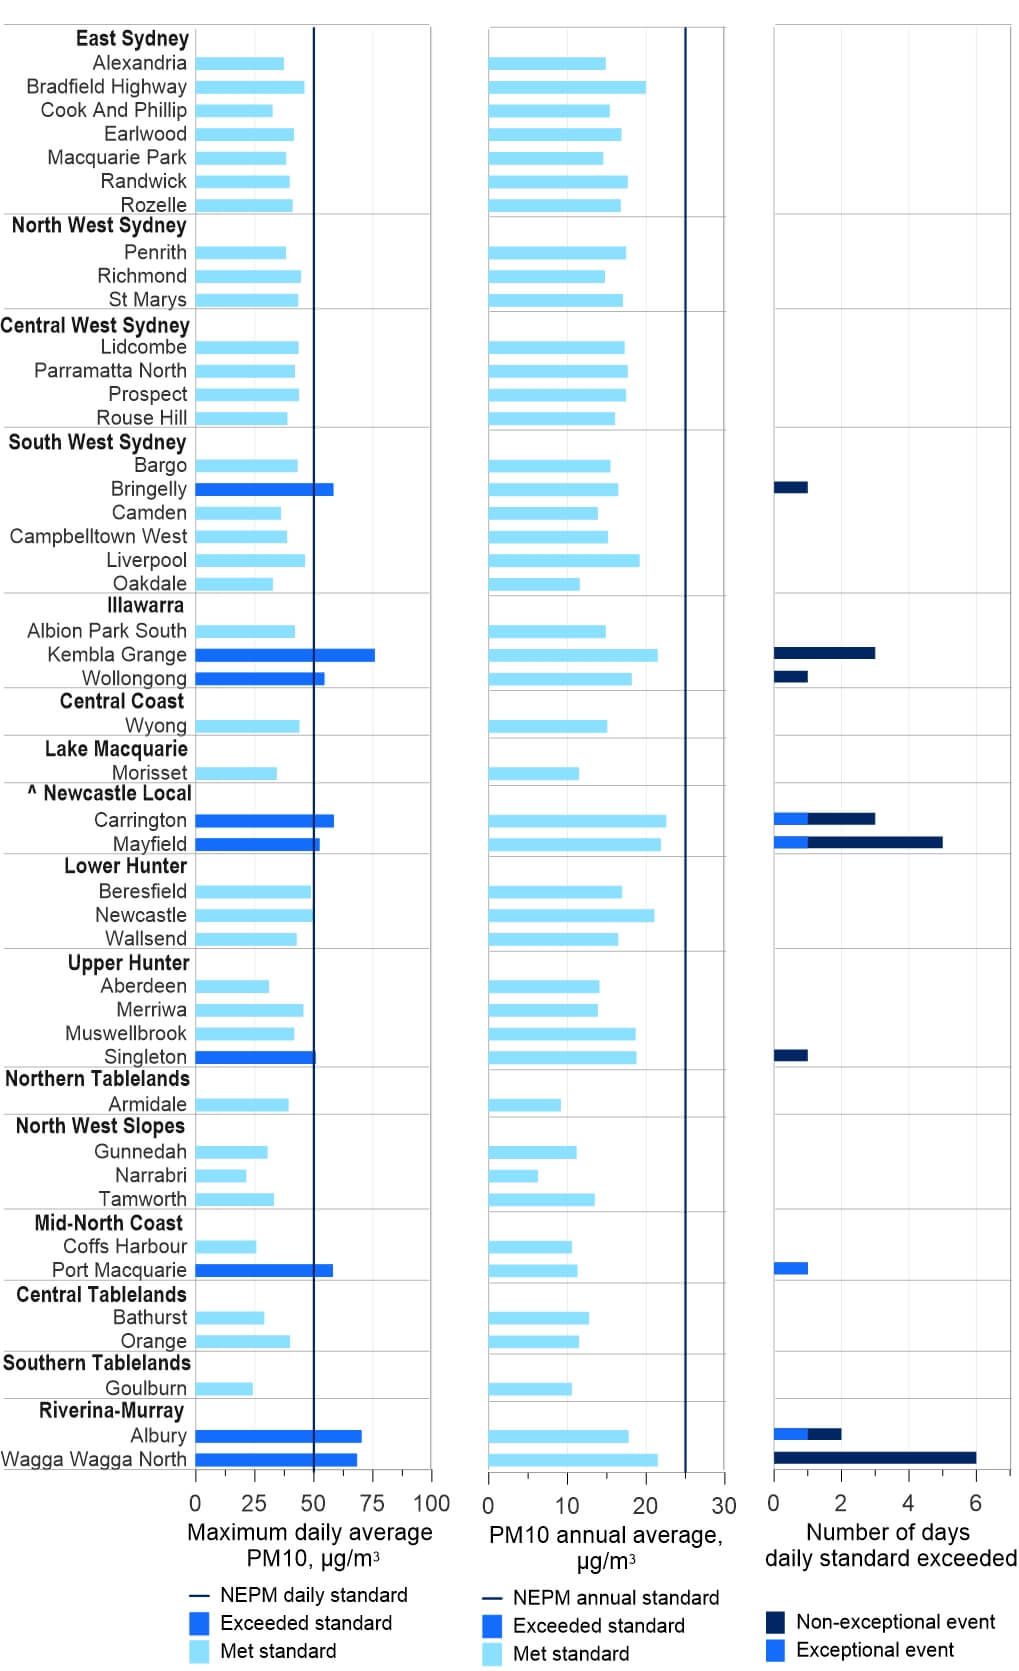
PM10 daily and annual summary for 2024
PM2.5 particles
- Daily average national standard – 25 micrograms per cubic metre of air (25 µg/m3).
- Annual average national standard – 8 micrograms per cubic metre of air (8 µg/m3).
Nine stations exceeded the PM2.5 daily standard during 2024 (see PM2.5 summary graph), compared with 27 stations in 2023.
The maximum daily average PM2.5 (53.6 µg/m3) was recorded on 4 September at Richmond in the North West Sydney region during hazard reduction burning. This was the only extremely poor air quality day in 2024. There were 5 such days in 2023, with these days observed at 10 air quality monitoring stations.
Two stations exceeded the PM2.5 daily standard most frequently, Armidale in Northern Tablelands (6 days) and Orange in Central Tablelands (5 days), both stations are impacted by wood heater smoke during the winter season.
Annual average PM2.5 levels exceeded the national standard at one station in 2024, compared with 2 stations in 2023. Bradfield Highway roadside monitoring station in East Sydney exceeded the standard for the second consecutive year, with an annual average PM2.5 level of 8.6 µg/m3. Since monitoring began in September 2018, the station has exceeded the annual standard in most years.
PM2.5 daily and annual summary
The graph below summarises PM2.5 measurements in metropolitan and regional population centres measuring PM2.5. It shows for PM2.5 the maximum daily average, annual average, and total count of event days.
Days exceeding standard are divided into exceptional and non-exceptional events. Exceptional events relate to bushfires, hazard reduction burns and continental-scale dust storms. These are not counted towards the NEPM (National Environment Protection Measures) goal of 'no days exceeding the particle standards in a year’.
The graph shows all Upper Hunter stations measuring PM2.5, including Camberwell station.
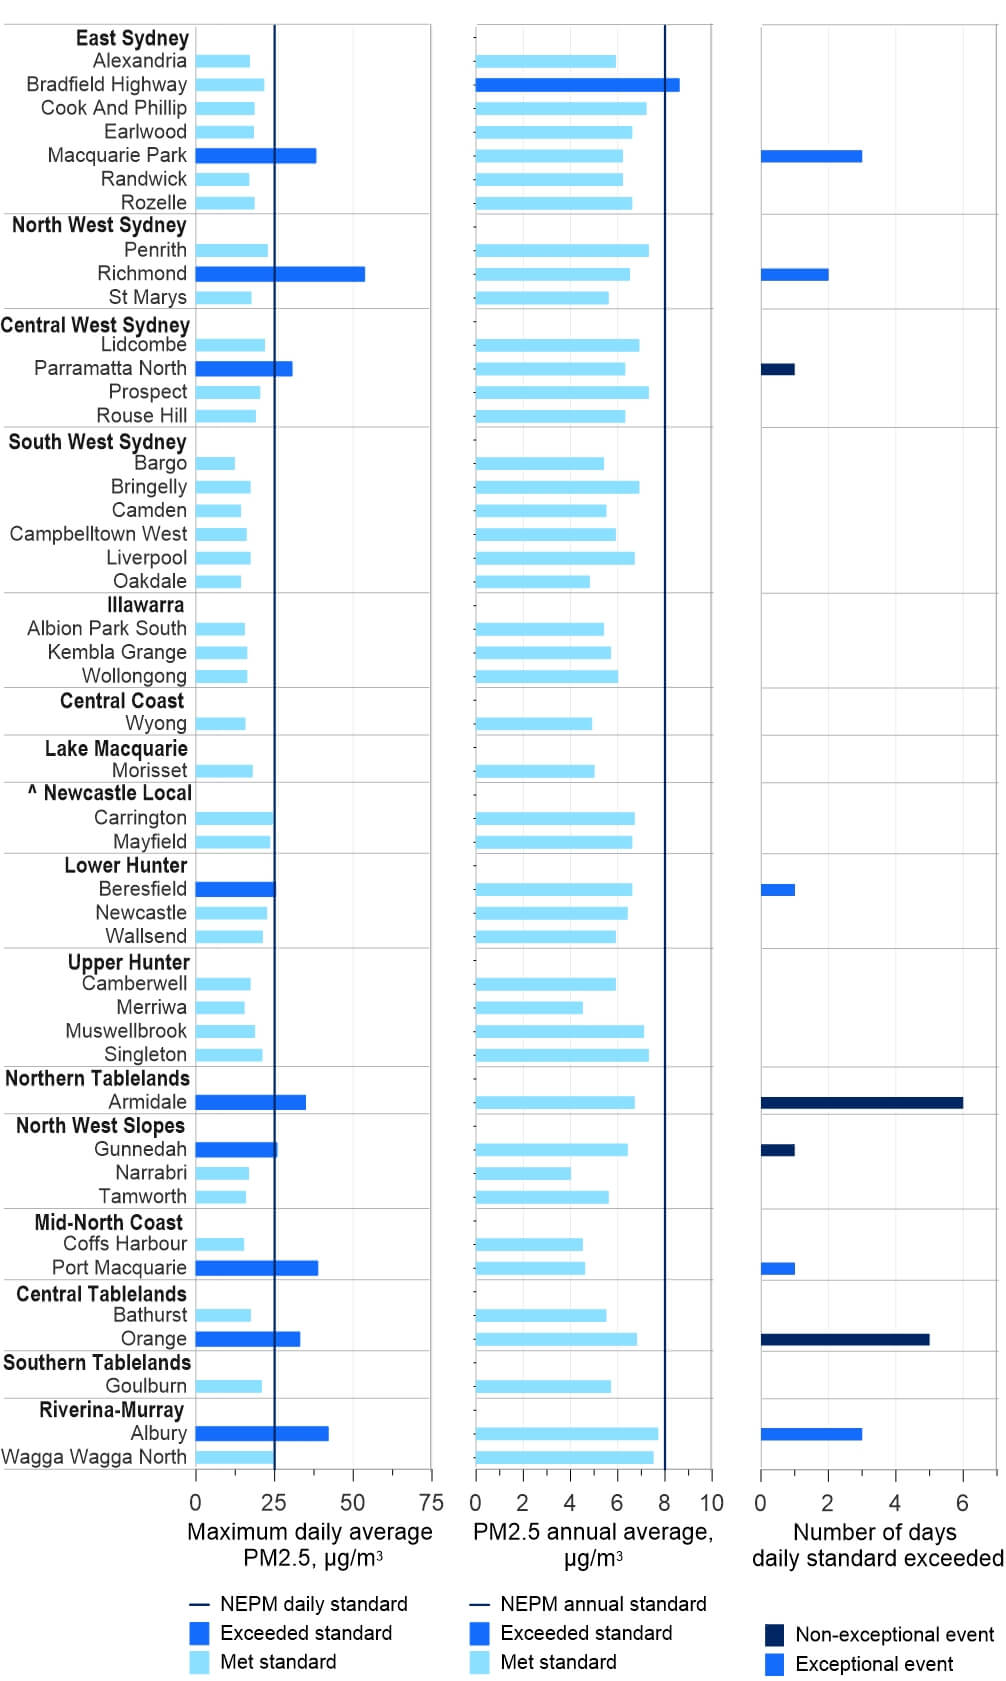
PM2.5 daily and annual summary for 2024