Benchmark for particles as PM2.5
- Daily average – 25 micrograms per cubic metre of air (25 µg/m3), national standard.
Note: PM2.5 refers to airborne particles less than 2.5 micrometres in diameter.
Key points
During spring–summer 2019–20, smoke raised daily PM2.5 concentrations to record levels across the NSW air quality monitoring networks. The 5 highest daily PM2.5 levels since 1994 were recorded between 15 November 2019 and 5 January 2020.
- Daily PM2.5 levels were above the benchmark on 99 days (or 54% of spring–summer days) in the standard monitoring network, mainly due to bushfire smoke in spring–summer 2019–20, compared to 4 days in spring–summer 2018–19. Bushfire emergency monitoring stations recorded 46 days above the benchmark, including 10 days not recorded by the standard monitoring network.
- The highest daily PM2.5 level reached 560 µg/m3, 22 times the benchmark, at Wagga Wagga North in the South-west Slopes on 5 January 2020 due to bushfire smoke. This record ranked the highest daily PM2.5 level since 1994.
The highest daily PM2.5 level reached 560 µg/m3, 22 times the benchmark, at Wagga Wagga North in the South-west Slopes on 5 January 2020 due to bushfire smoke. This record ranked the highest daily PM2.5 level since 1994.
More detail
Maximum daily and hourly PM2.5 concentrations recorded across the regions of the NSW Air Quality Monitoring Network are summarised below.
- Maximum daily PM2.5 levels ranged from 80 µg/m3 (three times the benchmark) in the Upper Hunter to 560 µg/m3 (22 times the benchmark) in the South-west Slopes.
- Wagga Wagga North in the South-west Slopes recorded the highest daily PM2.5 level since 1994, with 560 µg/m3 on 5 January 2020. A slow-moving low-pressure trough, with light winds turning southwest to southeast, brought thick smoke to the South-west Slopes in the afternoon. The hourly PM2.5 levels at Wagga Wagga North peaked at 1799 µg/m3 at 7pm in the evening on this day.
- The second to the fifth highest daily PM2.5 levels since 1994 also occurred in spring-summer 2019-20.
- The bushfire air quality monitoring station at Port Macquarie on the Mid-North Coast recorded 443 µg/m3 (18 times the benchmark) on 15 November 2019.
- The Katoomba air quality monitoring station in the Blue Mountains and Lithgow Air Watch Project recorded 436 µg/m3 (17 times the benchmark) on 26 December 2019.
- The Goulburn air quality monitoring station in the Southern Tablelands, commissioned on 6 November 2019, recorded 516 µg/m3 (21 times the benchmark) on 1 January 2020 and 480 µg/m3 (19 times the benchmark) on 5 January 2020.
- Before spring–summer 2019–20, the highest daily PM2.5 level was 416 µg/m3 (almost 17 times the benchmark), recorded at Wallsend in the Lower Hunter on 23 September 2009, during the Red Dawn dust event.
- Maximum daily PM2.5 levels at bushfire air quality monitoring stations ranged from 44 µg/m3 (2 times the benchmark) at Lismore in the Northern Rivers to 443 µg/m3 (18 times the benchmark) at Port Macquarie.
- Maximum hourly PM2.5 levels at standard monitoring stations ranged from 212 µg/m3 in the Newcastle Local region to 2182 µg/m3 in the Southern Tablelands.
- Maximum hourly PM2.5 levels at bushfire standard monitoring stations ranged from 149 µg/m3 at Lismore to 1280 µg/m3 at Port Macquarie.
- Maximum hourly PM2.5 levels at bushfire indicative monitoring stations ranged from 461 µg/m3 at Coffs Harbour to 2500 µg/m3 at Batemans Bay on the South Coast (Note: the Coffs Harbour bushfire monitoring station operated standard and indicative monitoring instruments during November 2019 to February 2020, as a scientifically controlled approach to bushfire air quality monitoring).
Summary statistics
Daily average PM2.5 levels in spring-summer 2019-20
The standard monitoring network recorded a total of 99 days above the benchmark, mainly due to bushfire smoke.
- Ranging from 24 to 51 days at stations across the Illawarra and Sydney regions (Sydney North-west, Sydney South-west and Sydney East)
- 40 to 44 days across the Northern Tablelands and North-west Slopes
- 40 days in the Blue Mountains (measured at Katoomba)
- 37 to 44 days across the Central and Southern Tablelands and the South-west Slopes
- 25 to 38 days across the Central Coast, Newcastle Local region and the Upper and Lower Hunter
The bushfire monitoring stations in the Northern Rivers and Mid-North Coast recorded a total of 46 days above the benchmark, including 10 days that were not observed in the standard network.
- 44 days at Port Macquarie on the Mid-North Coast
- 15 days at Coffs Harbour on the Mid-North Coast
- 9 days at Lismore in the Northern Rivers
Note: The Northern Rivers and Mid-North Coast most likely experienced PM2.5 levels above the benchmark before monitoring began at Coffs Harbour and Lismore on 22 and 24 November 2019, respectively.
- Ranging from 387 to 560 µg/m3 (15 to 22 times the benchmark) across the Central and Southern Tablelands and the South-west Slopes
- 436 µg/m3 (17 times the benchmark) in the Blue Mountains (at Katoomba)
- 164 to 267 µg/m3 (7 to 11 times the benchmark) across the North-west Slopes and Northern Tablelands
- 101 to 250 µg/m3 (4 to 10 times the benchmark) across the Illawarra and Sydney regions
- 80 to 202 µg/m3 (3 to 8 times the benchmark) across the Upper and Lower Hunter, Newcastle Local and Central Coast regions.
- 44 µg/m3 (2 times the benchmark) at Lismore
- 114 µg/m3 (5 times the benchmark) at Coffs Harbour
- 443 µg/m3 (18 times the benchmark) at Port Macquarie
The 5 highest daily PM2.5 levels since 1994 were recorded in spring-summer 2019-20, mainly due to bushfire smoke.
- Highest, 2020: 560 µg/m3 at Wagga Wagga North on 5 January 2020, mainly due to bushfire smoke
- Second highest, 2020: 516 µg/m3 at Goulburn in the Southern Tablelands on 1 January 2020 mainly due to bushfire smoke
- Third highest, 2020: 480 µg/m3 at Goulburn on 5 January 2020 mainly due to bushfire smoke
- Fourth highest, 2019: 443 µg/m3 at Port Macquarie on 15 November 2019 mainly due to bushfire smoke
- Fifth highest, 2019: 436 µg/m3 at Katoomba on 26 December 2019 mainly due to bushfire smoke
- Sixth highest, 2009: 416 µg/m3 at Wallsend on 23 September 2009 during the Red Dawn dust event.
Hourly average PM2.5 levels in spring–summer 2019–20
The NSW Government began reporting hourly average PM2.5 levels in February 2020 in response to public needs.
- Ranging from 1799 to 2182 µg/m3 across stations in the South-west Slopes and the Southern Tablelands
- 1415 µg/m3 in the Blue Mountains (measured at Katoomba)
- 380 to 790 µg/m3 across the Illawarra and Sydney regions
- 616 µg/m3 across the Central Tablelands
- 505 to 918 µg/m3 across the North-west Slopes and Northern Tablelands
- 212 to 359 µg/m3 across the Newcastle local region, the Upper and Lower Hunter and the Central Coast
- 149 µg/m3 at Lismore at 9am on 12 December 2019
- 337 µg/m3 at Coffs Harbour at 9am on 23 November 2019
- 1280 µg/m3 at Port Macquarie at 11am on 15 November 2019
- 2500 µg/m3 at Batemans Bay on the South Coast at 12pm on 31 December 2019
- 1675 µg/m3 at Ulladulla on the South Coast at 5am on 23 December 2019
- 689 µg/m3 at Grafton in the Northern Rivers at 11am on 23 November 2019
- 637 µg/m3 at Cooma in the Southern Tablelands at 7am on 31 January 2020
- 610 µg/m3 at Taree on the Mid-North Coast at 8am on 22 November 2019
- 505 µg/m3 at Merimbula on the South Coast at 10am on 16 January 2020
- 461 µg/m3 at Coffs Harbour on the Mid-North Coast at 8am on 23 November 2019
Note: The indicative bushfire emergency monitoring locations may have experienced higher PM2.5 levels before monitoring began at each station.
- Ranging from 761 to 2700 µg/m3 across two stations in the Riverina region, due to dust
- 219 to 1384 µg/m3 across 11 stations in the Western region, due to bushfire smoke and dust
- 301 to 814 µg/m3 across two stations in the Victorian Mallee Catchment Management Authority region, due to bushfire smoke and dust
- 337 to 624 µg/m3 across three stations in the North West region, due to bushfire smoke and dust
- 594 µg/m3 in the Central West region (measured at Dubbo) due to bushfire smoke
- 274 µg/m3 in the Murray region (measured at Kyalite), due to bushfire smoke
Note: Region refers to NSW Local Land Services region.
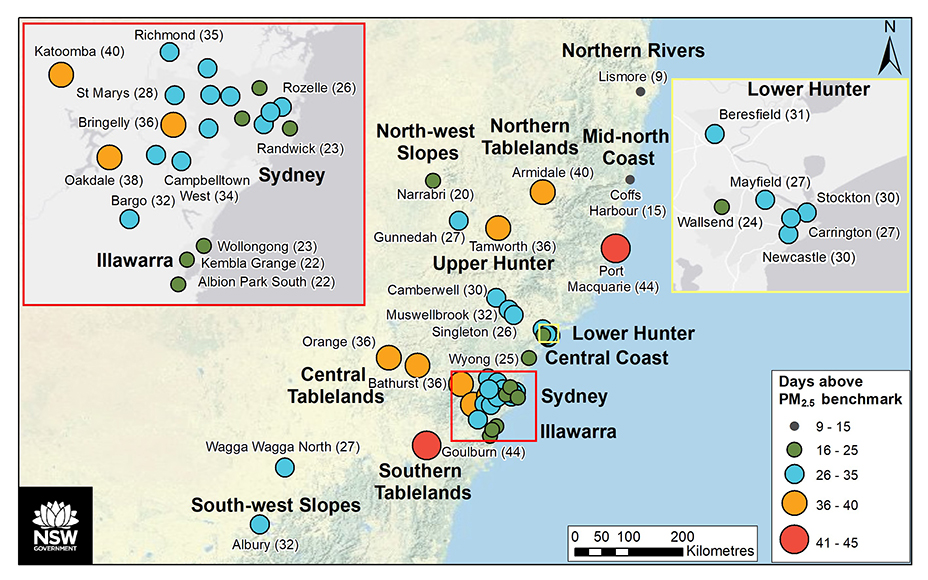
Number of days with PM2.5 24-hour (daily) average concentrations above the national benchmark of 25 µg/m3, across stations in the standard monitoring network and at bushfire emergency standard monitoring stations, during spring-summer 2019–20. Stations nearer to bushfires recorded more days above the benchmark.
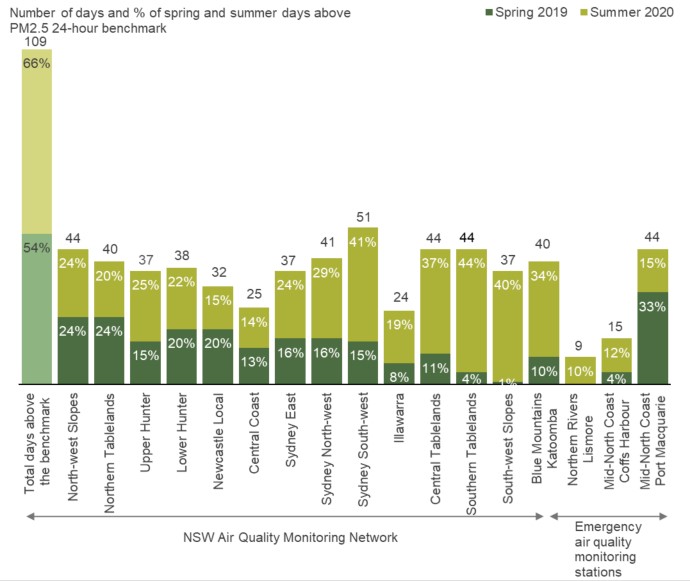
Number and percentage of days in spring and summer 2019–20 with PM2.5 24-hour average concentrations above the benchmark across regions in the NSW standard monitoring network and at bushfire air quality monitoring stations, during spring–summer 2019–2020. Generally, more days above the benchmark were recorded in summer than in spring.
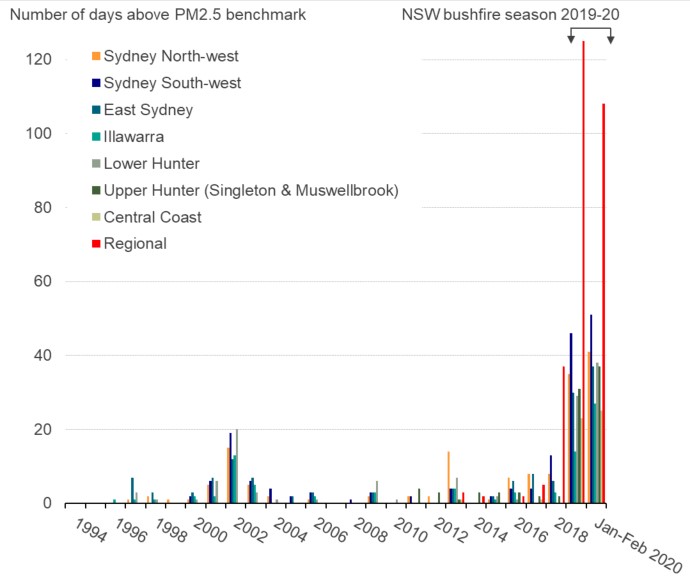
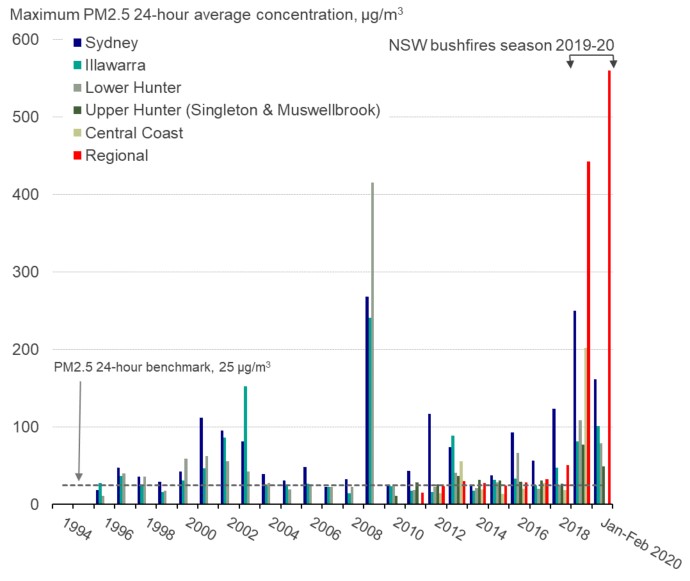
Annual number of days above the PM2.5 daily benchmark, in 1994–2019 compared to January–February 2020
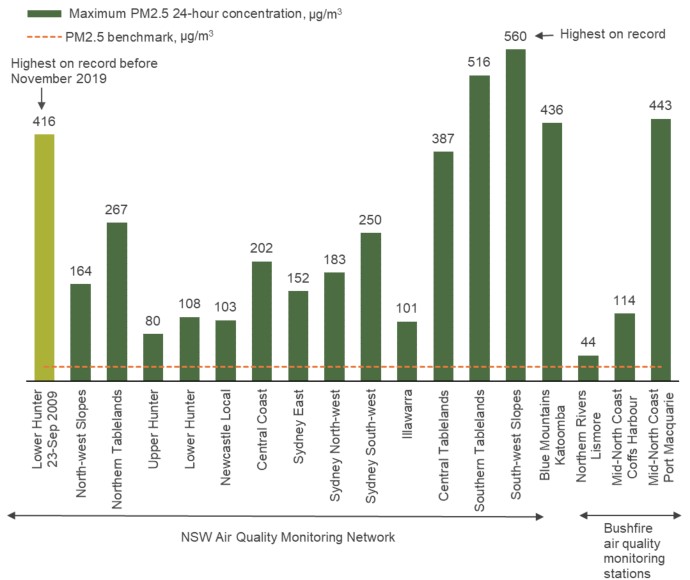
Maximum PM2.5 24-hour concentrations across the regions in the standard monitoring network and at the bushfire air quality monitoring stations during spring-summer 2019–20.
Maximum regional daily PM2.5 from 1 September 2019 to 29 February 2020 for Sydney and Illawarra regions. Generally, the highest levels were recorded from mid-November 2019 to early January 2020.
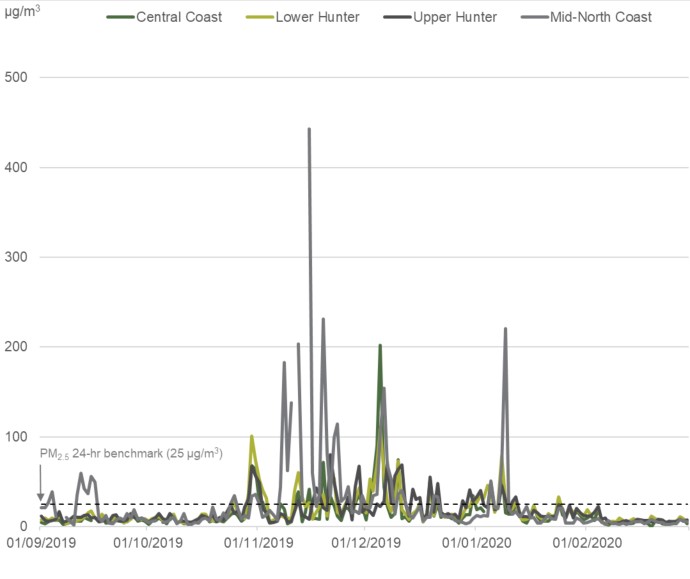
Maximum regional daily PM2.5 from 1 September 2019 to 29 February 2020 for Sydney and Illawarra regions. Generally, the highest levels were recorded from mid-November 2019 to early January 2020.
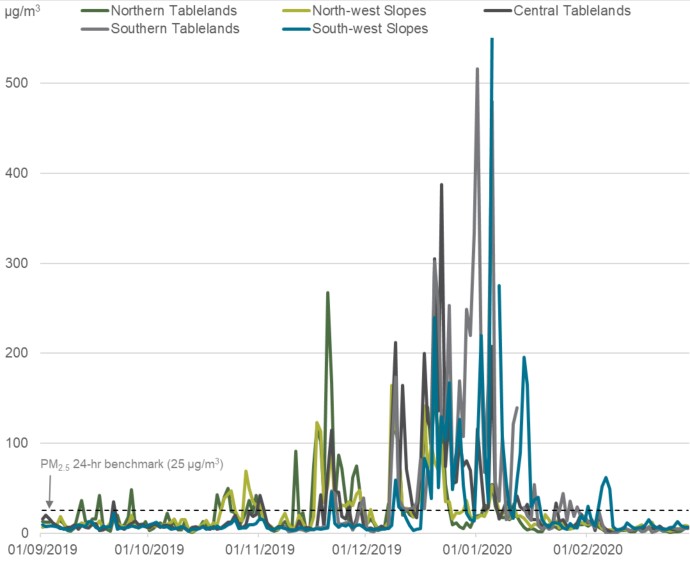
Maximum regional daily PM2.5 from 1 September 2019 to 29 February 2020 for Northern Tablelands, North-west Slopes, Central Tablelands, Southern Tablelands and South-west Slopes regions. Generally, the highest levels were recorded from mid-November to mid-January.
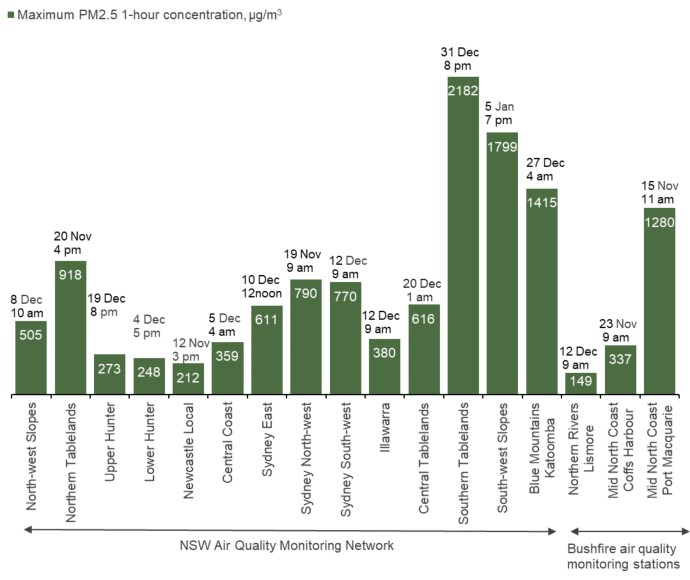
Maximum hourly PM2.5 levels showing times and dates recorded across NSW regions and bushfire air quality monitoring stations, during spring–summer 2019–20
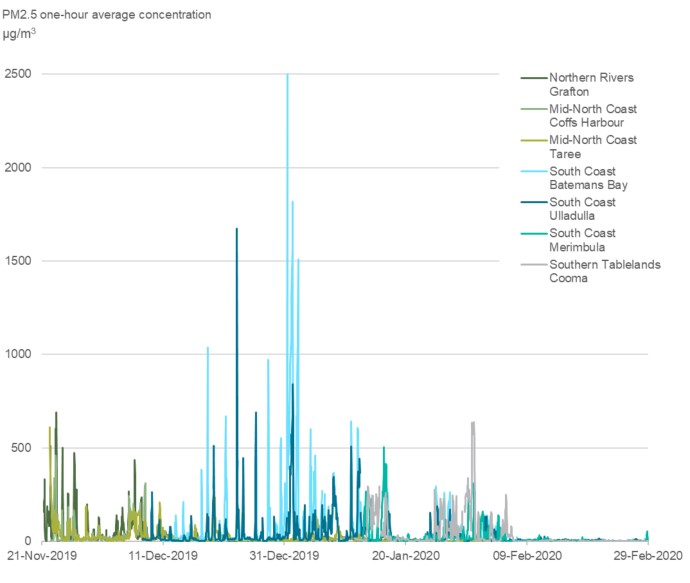
PM2.5 one-hour average concentrations recorded by indicative monitors at bushfire air quality monitoring stations, 21 November 2019 to 29 February 2020. Northern regions recorded highest levels from late November to mid-December. Southern regions recorded highest levels from mid-December to late January.
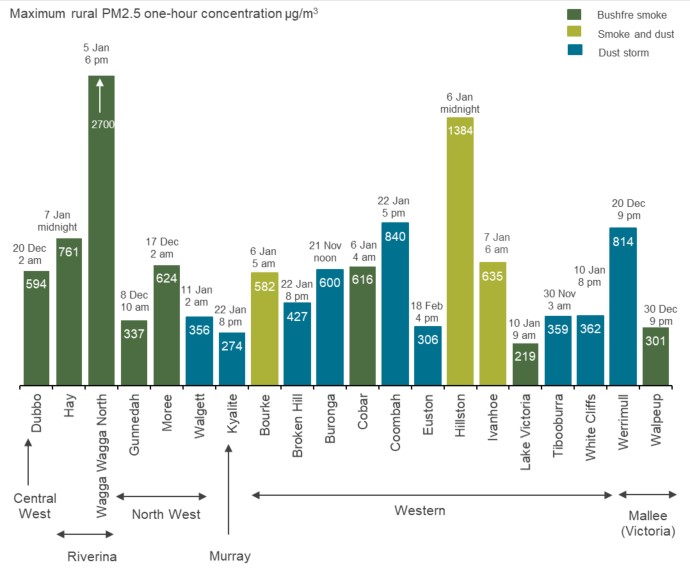
Maximum rural PM2.5 one-hour average concentrations recorded by indicative monitors at long-term rural air quality monitoring stations, spring–summer 2019–20.