Summary
- One of the major effects of the COVID-19 pandemic related lockdowns and other socio-economic restrictions issued by the State and Commonwealth public health authorities, was a reduction in vehicle traffic. Vehicle exhaust is a key contributor to urban air pollution in New South Wales.
- Two examples of how the COVID-19 related restrictions impacted air quality in New South Wales are provided. These focus on nitrogen oxides (NOx), here defined as the total of nitrogen dioxide (NO2) and nitric oxide (NO), which are one family of key air pollutants species generated by fossil fuel combustion. Key findings are:
- reductions in NOx concentrations were observed at a roadside air quality monitoring station, consistent with the reduction in vehicle numbers during 2020
- further reductions in NOx concentrations were observed at several stations in the network during various stages of COVID-19 related restrictions on social activity in the year.
- levels of NO2, one component in NOx, also decreased at some stations in the network during the May–June period, when compared with previous years.
- Air quality impacts which result from changes in emissions can be difficult to quantify with direct measurements alone, as air quality can be affected by many factors including meteorology (e.g. wind, temperature and rainfall) and other pollution sources (such as bushfires) and atmospheric chemistry. Further research is underway to holistically investigate the overall air quality impacts (e.g. carbon monoxide, NOx, particle and ozone levels) due to pandemic-related restrictions.
Background
Restrictions and changes in community behaviour associated with COVID-19 pandemic occurred from March 2020. The pandemic has resulted in a change in how the community works and undertakes other activities, which in turn can affect air quality.
Reductions in vehicle traffic were anticipated to have a large impact on NOx emissions and associated nitrogen dioxide (NO2) levels in the air. The reductions will also lower other pollutant emissions, such as carbon monoxide, particulate matter and volatile organic compounds.
In this brief analysis, we focused on the changes in NOx and NO2 concentrations associated with the COVID-19 related restrictions on social activities and the subsequent reduction in vehicle traffic volume. NOx concentrations in 2020 were compared against previous years at: (a) a roadside air quality monitoring station; and (b) ambient air quality monitoring stations in the Greater Metropolitan Region.
Bradfield Highway
A roadside monitoring station was commissioned in October 2018 to measure pollutant concentrations adjacent to Bradfield Highway in Milsons Point. This road is the northern entrance to the Sydney Harbour Bridge and is one of the busiest roads in New South Wales.
Data on vehicle numbers were not available for the section of the highway next to the monitoring station. However, traffic data for the Cahill Expressway, one of the connecting roads on the southern side of the Harbour Bridge, were available. The data showed a significant reduction in vehicle numbers during the COVID-19 lockdowns in 2020, compared with the same periods in 2019.
- NOx concentrations on weekdays over 4 time periods in 2020 were compared with 2019:
- Period 1: Pre-COVID-19 (1 February to 10 March)
- Period 2: COVID-19 lockdown (21 March to 30 April). This involved restriction of non-essential travel.
- Period 3: Gradual easing phase (1 May to 30 June). Gradual easing of travel restrictions from mid-May.
- Period 4: Further easing phase (1 July to 31 August). Further easing of travel restrictions from early July.
- NOx concentrations during the pre-COVID-19 period were similar between 2019 and 2020, across the entire day. The profile showing peaks in the morning and evening is consistent with higher vehicle numbers during peak hours.
- A reduction in NOx concentrations was observed during each of the 3 lockdown periods in 2020, when compared to 2019. This was consistent with the reduction in the number of vehicles shown below. The differences between 2019 and 2020 were greater during Period 2 and Period 3, which were the lockdown and gradual easing periods. As travel restrictions further eased and traffic numbers increased in Period 4, the difference between NOx concentrations narrowed.
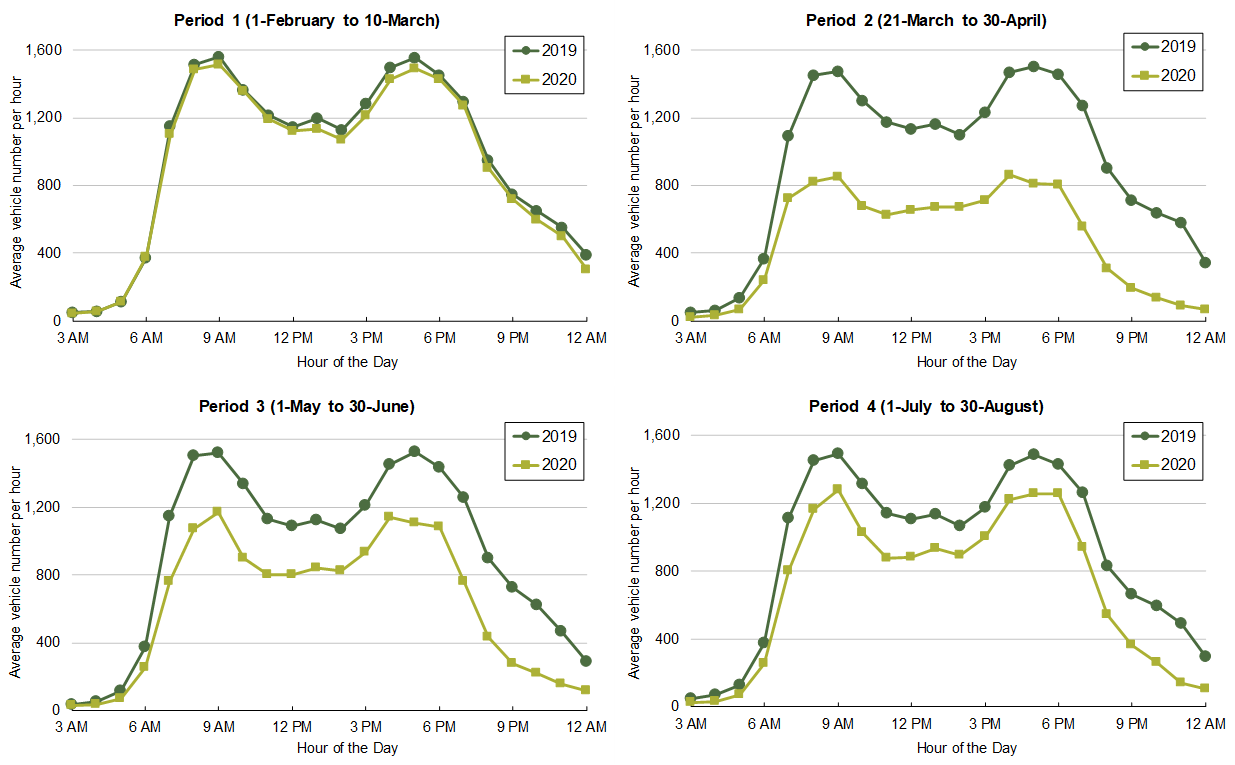
Weekday vehicle numbers on Cahill Expressway, one of the major roads which feeds to the southern access of the Sydney Harbour Bridge, by hour of the day during the 4 periods of analysis. From the NSW Roads and Maritime Service Traffic Volume Viewer
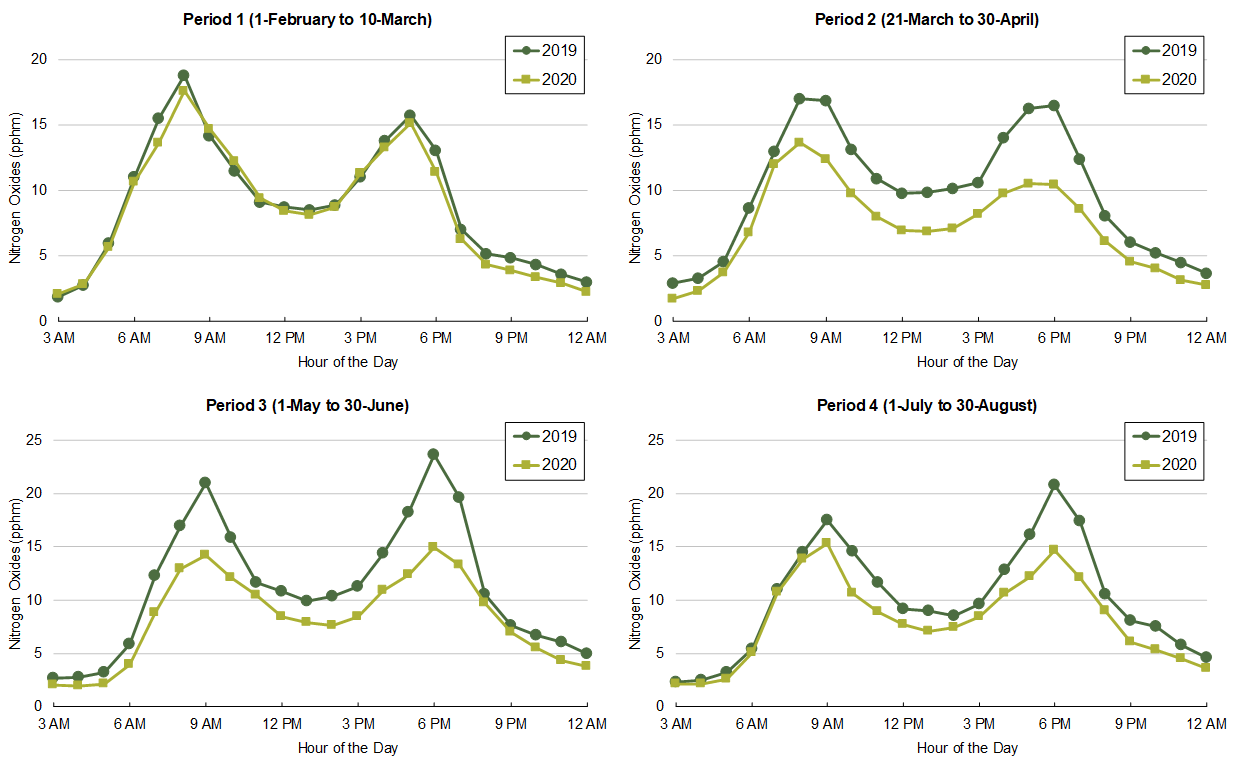
Comparison of hourly average NOx concentrations at roadside Bradfield Highway monitoring station on weekdays in 2019 and 2020, by hour of the day.
Greater Metropolitan Region
- A comparison was made between weekday average concentrations of NOx and NO2 at selected locations in the Greater Metropolitan Region (GMR), comprising the Sydney, Central Coast, Lower Hunter and Illawarra regions.
- NOx concentrations typically are higher in cooler months in urban areas, due to cooler temperatures and less turbulent air mixing of NOx emissions within the lower atmosphere. Additionally, long-term NOx concentrations are falling at some locations due to improvements in emissions technologies.
Sydney
Average concentrations of nitrogen oxides (NOx) and nitrogen dioxide (NO2) are compared between 2014 and 2020 at Randwick (Sydney East), Chullora (Sydney Central East) and Richmond (Sydney West) monitoring stations in Sydney. Four time periods in each year are compared, which correspond to pre-COVID, first lockdown, gradual easing and further easing phases in 2020.
Overall, there were distinguishable reductions in total weekday average NOx and NO2 concentrations in Period 3 (May-June) and Period 4 (July-August), compared to previous years. NOx and NO2 levels in Period 2 (the strictest lockdown in March and April) were generally lower compared to 2019, but not very different from some previous years (e.g. 2018) at Randwick and Chullora.
It is acknowledged that variations in NOx and NO2 levels may also be associated with the effect of the interannual variability in meteorology, difference in spatial positioning of monitoring stations relative to emission sources, and atmospheric chemistry. Research is under way to further examine the potential effects of different factors on air quality for the period of interest.
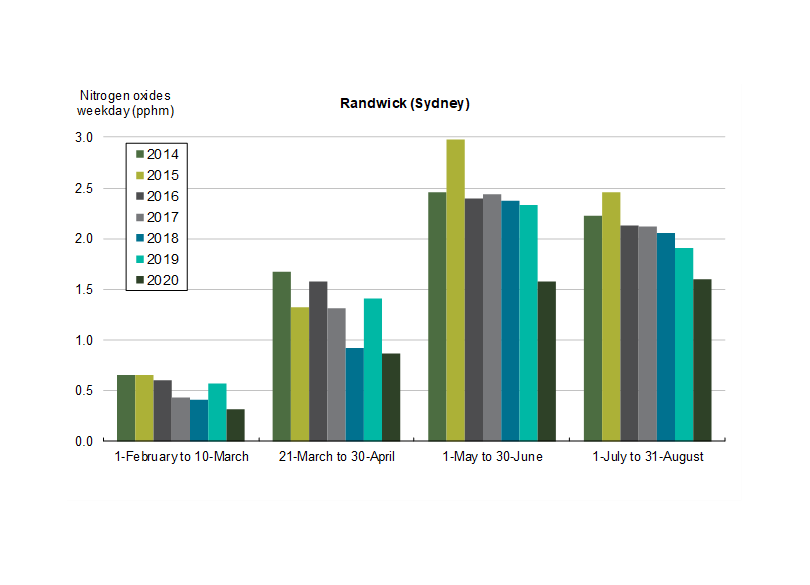
Weekday NOx averages at Randwick, between 2014-2020. Comparing during pre-COVID (1-February to 10-March); during first lockdown (21-March to 30-April); during gradual easing (1-May to 30-June); and during further easing phases (1-July to 31-August).
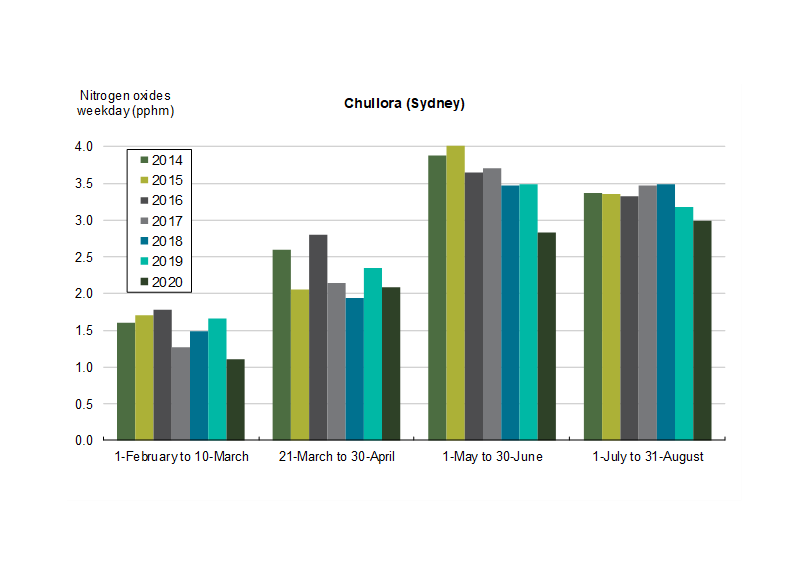
Weekday Nitrogen oxides (NOx) averages at Chullora, Sydney,between 2014-2020. Comparing time periods during pre-COVID; during first lockdown; during gradual easing; and during further easing phases.
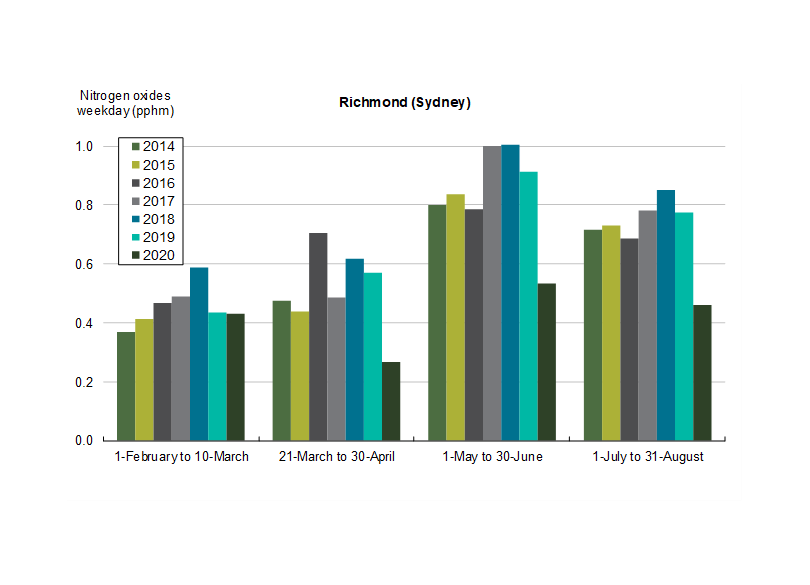
Weekday Nitrogen oxides (NOx) averages at Richmond, Sydney, between 2014-2020. Comparing time periods during pre-COVID; during first lockdown; during gradual easing; and during further easing phases.
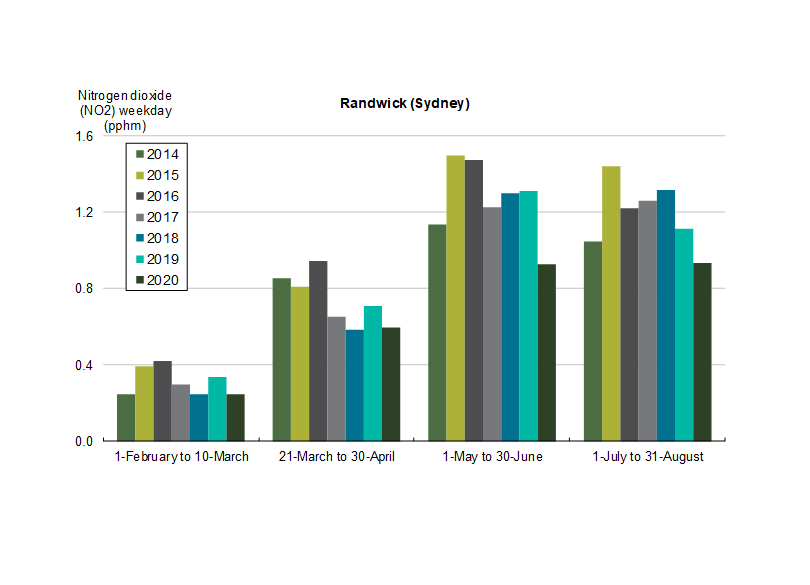
Weekday Nitrogen dioxide (NO2) averages at Randwick, Sydney, between 2014-2020. Comparing time periods during pre-COVID; during first lockdown; during gradual easing; and during further easing phases.
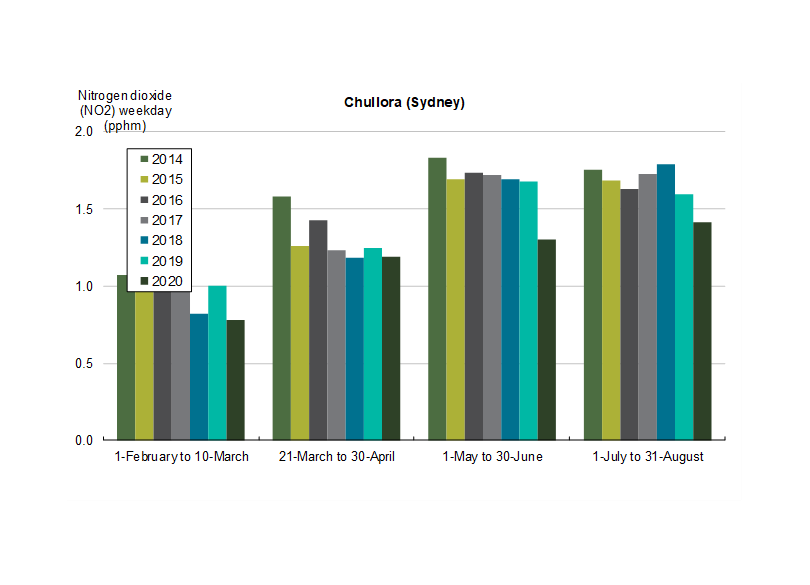
Weekday Nitrogen dioxide (NO2) averages at Chullora, Sydney, between 2014-2020. Comparing time periods during pre-COVID; during first lockdown; during gradual easing; and during further easing phases.
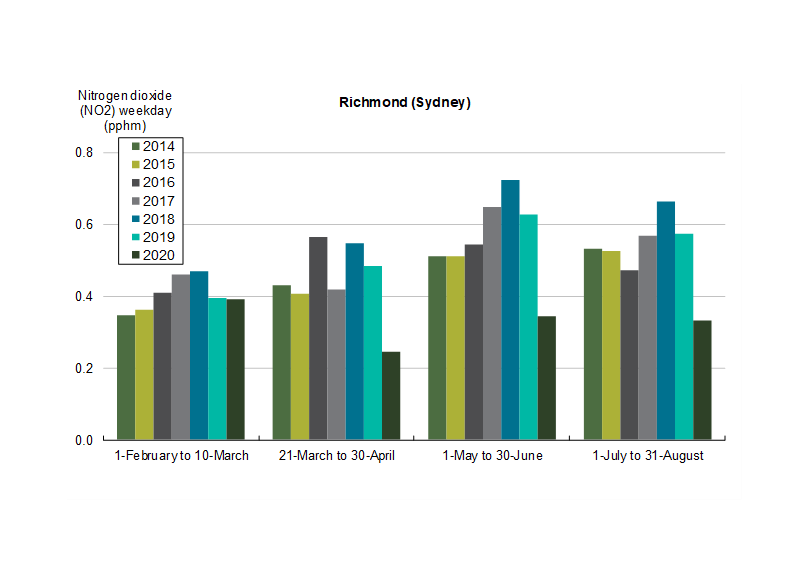
Weekday Nitrogen dioxide (NO2) averages at Richmond, Sydney, between 2014-2020. Comparing time periods during pre-COVID; during first lockdown; during gradual easing; and during further easing phases.
Lower Hunter, Central Coast and Illawarra
Average concentrations of nitrogen oxides (NOx) and nitrogen dioxide (NO2) are compared between 2014 and 2020 at Newcastle (Lower Hunter), Wyong (Central Coast) and Wollongong (Illawarra) monitoring stations. Four time periods in each year are compared, which correspond to pre-COVID, first lockdown, gradual easing and further easing phases in 2020.
All three monitoring stations in the Lower Hunter, Central Coast and Illawarra regions recorded significant reductions in NOx and NO2 concentrations during Period 3 (May – June) in 2020, when compared to previous years.
For Periods 2 and 4, the comparison results appear complex and the reason for this is currently under investigation.
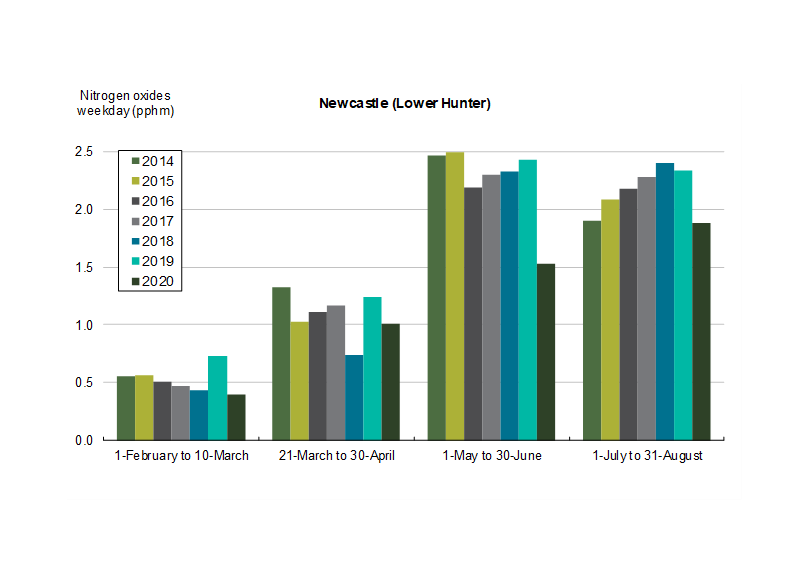
Weekday Nitrogen oxides averages at Newcastle, Lower Hunter, monitoring station between 2014-2020. Comparing time periods between: pre-COVID; first lockdown; gradual easing; and further easing phases.
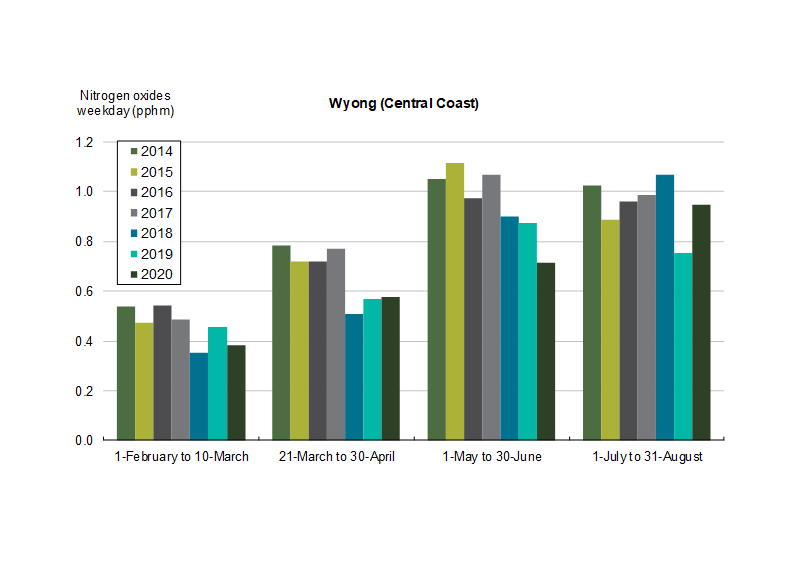
Weekday Nitrogen oxides averages at Wyong, Central Coast, monitoring station between 2014-2020. Comparing time periods during: pre-COVID; first lockdown; during gradual easing; and during further easing phases.
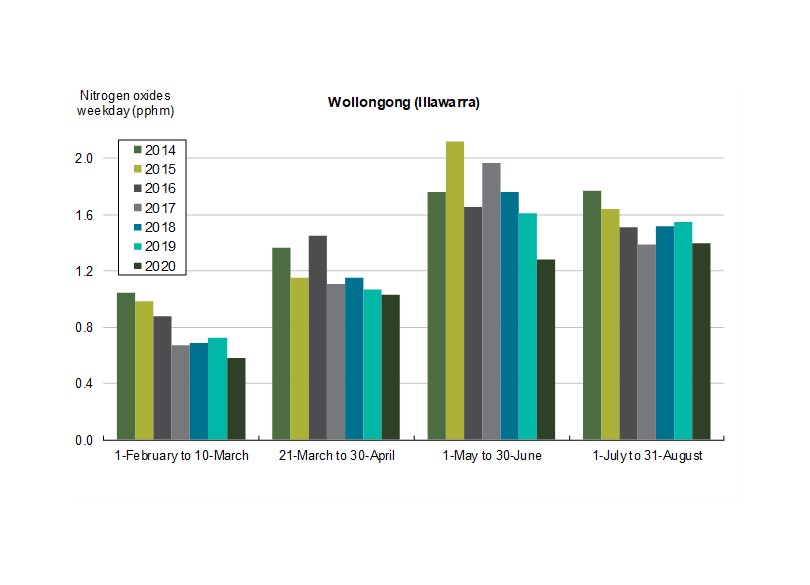
Weekday Nitrogen oxides averages at Wollongong, Illawarra, monitoring station between 2014-2020. Comparing time periods during: pre-COVID; first lockdown; during gradual easing; and during further easing phases.
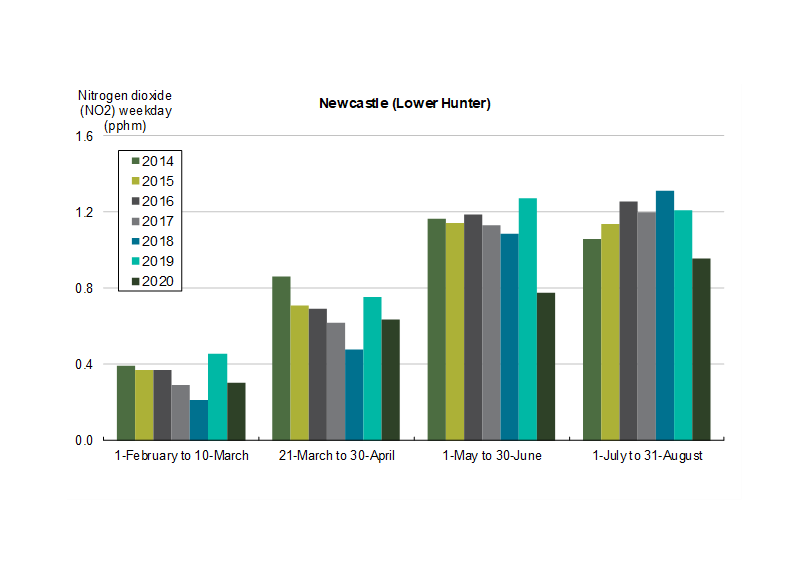
Weekday Nitrogen dioxide averages at Newcastle, Lower Hunter, monitoring station between 2014-2020. Comparing time periods during: pre-COVID; first lockdown; during gradual easing; and during further easing phases.
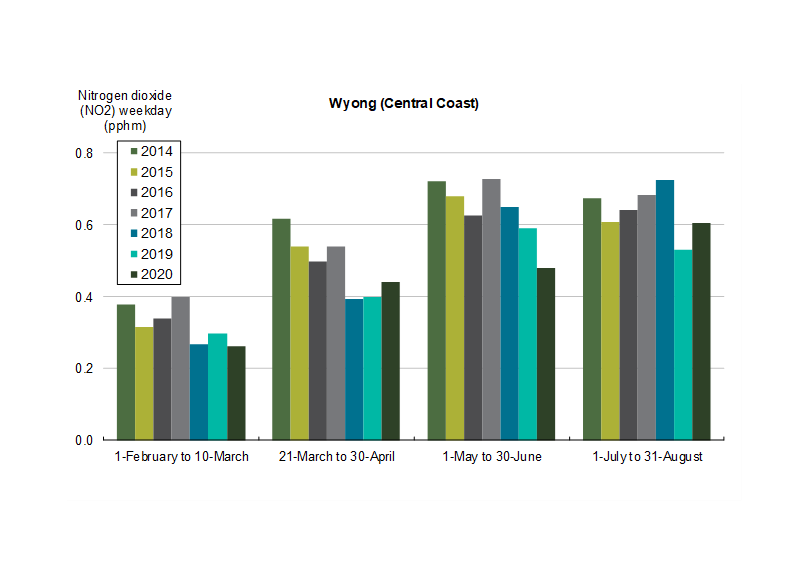
Weekday Nitrogen dioxide averages at Wyong, Central Coast, monitoring station between 2014-2020. Comparing time periods during: pre-COVID; first lockdown; during gradual easing; and during further easing phases.
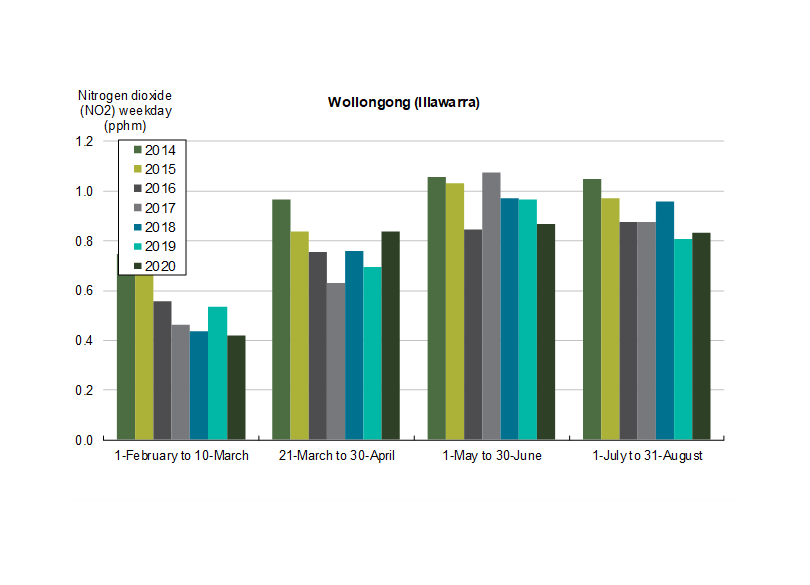
Weekday Nitrogen dioxide averages at Wollongong, Illawarra, monitoring station between 2014-2020. Comparing time periods during: pre-COVID; first lockdown; during gradual easing; and during further easing phases.