Summary
In 2020, air quality levels remained within national standards at metropolitan and regional population centres from 85% of the year in the Newcastle Local region to 99% of the time on the Mid-north Coast. (Refer to Figure: Percentage of days exceeding and within quality reporting standards, across regions in the standard NSW monitoring network)
The network recorded 118 days in 2020 with one or more criteria pollutant levels over national standards at one or more metropolitan or regional population centres (compared with 209 days in 2019). Excluding Stockton, where sea salt is a major contributor to PM10 levels, there were 87 days in 2020 with pollution levels over national standards (compared with 192 days in 2019).
The days over national standards in 2020 were mostly due to elevated PM10 and PM2.5 levels, and secondarily ozone pollution. Levels for nitrogen dioxide (NO2), sulfur dioxide (SO2) and carbon monoxide (CO) remained below national standards in 2020.
In 2020, at NSW metropolitan or regional population centres there were:
- 87 days with daily PM10 particle levels over the national standards (compared with 175 days in 2019)
- 55 days with daily PM10 particle levels over the national standards, excluding Stockton (compared with 148 days in 2019)
- 59 days with daily PM2.5 particle levels over the national standards (compared with 137 days in 2019)
- 6 days with ozone levels over the national standards (compared with 33 days in 2019)
- no days with CO over the national standard (compared with 2 days in 2019)
- no days with NO2 over the national standards (compared with 1 day in 2019)
- no days with SO2 over the national standards (as in 2019).
Note: On any one given day, levels may have been over the standard for multiple pollutants, and at one or more air quality monitoring stations.
Widespread smoke and dust storms significantly affected air quality levels throughout the State during January and early February, during intense drought conditions and the extreme 2019–20 bushfire season (see the Air quality special statement spring-summer 2019–20 for more information).
In the industry-funded Newcastle Local network, Stockton is often affected by sea salt spray, particularly in the warmer months, due to its proximity to the coast. Local industrial sources also affect particle levels in the Hunter Valley. More information on the special purpose of industry-funded Hunter Valley monitoring networks is found in the Hunter Valley and Stockton tabs on the Focus areas webpage
Air quality in Armidale, within the Northern Tablelands region, is often affected by smoke from domestic wood heaters during the cooler months.
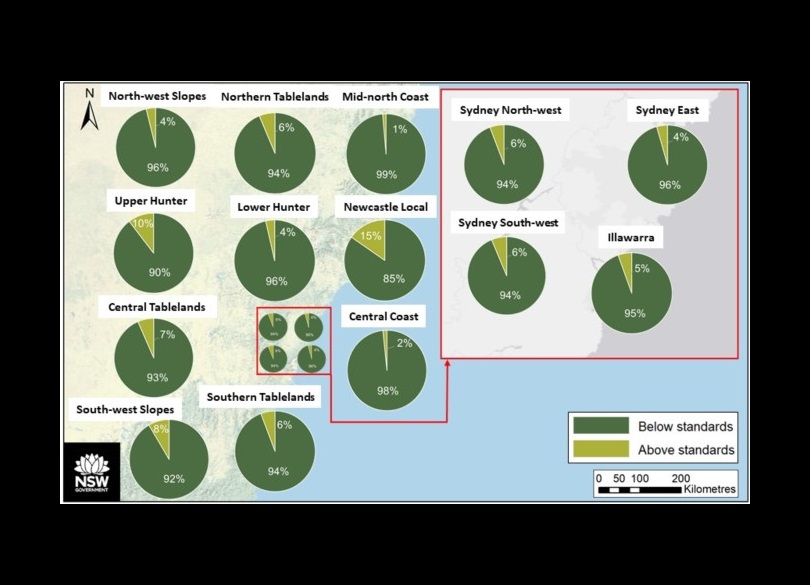
Percentage of days exceeding and within air quality standards, across regions in the standard NSW monitoring network – 2020
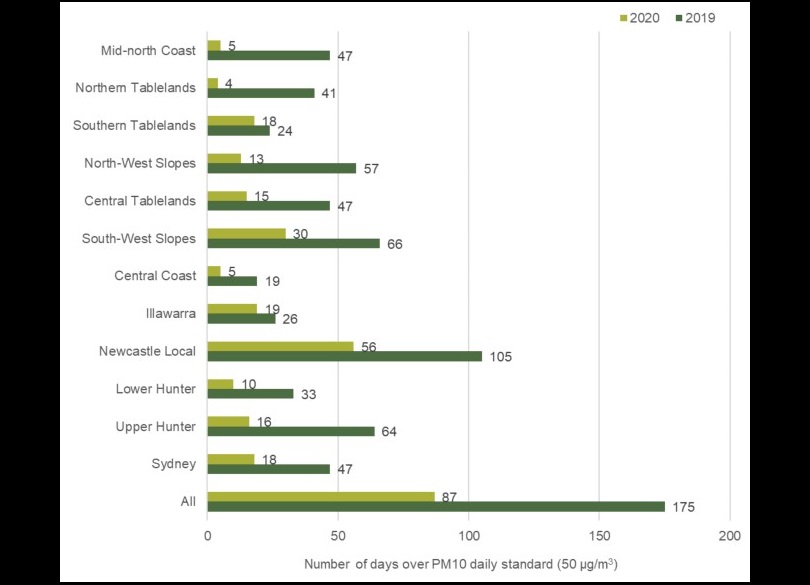
This bar chart reveals the significant number of days New South Wales regions exceeded the PM10 daily standard in 2019 and 2020. The chart drills down into regional air quality changes, with each region and year clearly represented by distinct bars.
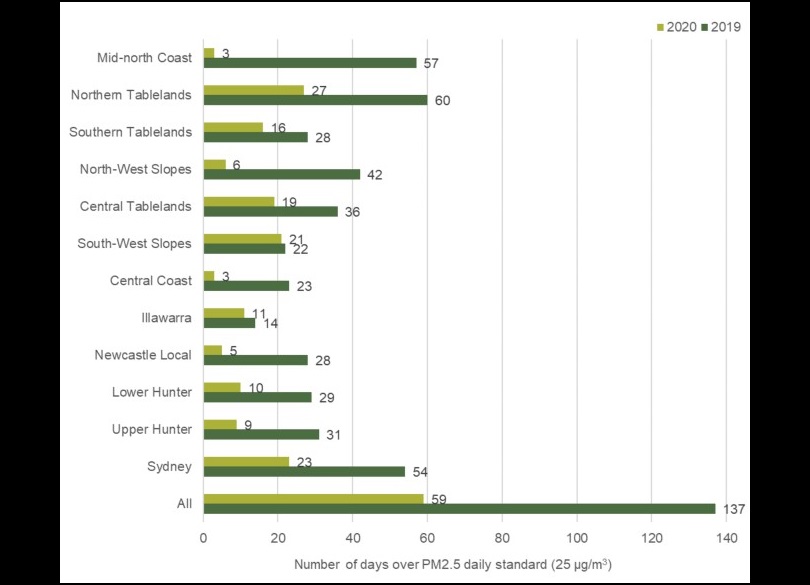
Bar chart showing how many days New South Wales areas exceeded the PM2.5 standard in 2019 and 2020.
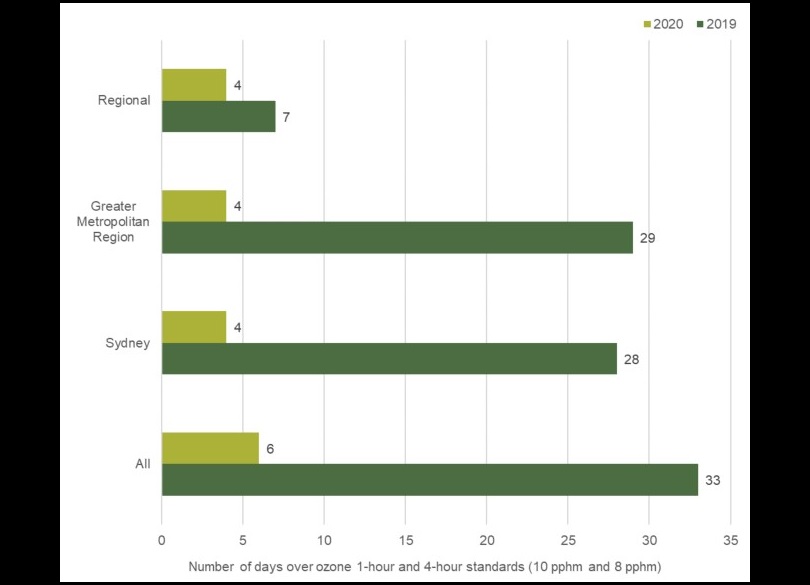
Days above ozone standards in three New South Wales regions for 2019 and 2020. Green bars are for 2020, and yellow for 2019. Each bar's height reveals the days over the standard.
Days with extreme air pollution levels
In this section, days with extreme air pollution levels are defined as those with pollution at levels exceeding twice the national standards for daily PM10, daily PM2.5 or ozone.
In 2020, days with extreme air pollution occurred as a result of elevated particle levels, with daily PM10 levels exceeding 100 µg/m3 or daily PM2.5 levels exceeding 50 µg/m3. Levels for ozone remained less than two times their relevant national standards.
There were 24 days with extreme air pollution at monitoring stations in metropolitan and regional centres, including the larger population centres in the Upper Hunter, in 2020. These occurred on 1–15, 17, 20 and 23–24 January; 1 and 5–6 February; 20 August; and 6 September 2020.
Most of these (22 days, 92%) occurred in January and early February, during intense drought conditions, frequent widespread dust storms and extensive smoke that accompanied the extreme 2019–20 bushfire season. On 20 August, the northeast of the State was affected by a widespread dust storm. On 6 September, Bargo in Sydney South-west was affected by smoke from hazard reduction burns (as reported by the NSW Rural Fire Service).
During 2020, days with extreme air pollution were attributed to the following sources:
- 10 days due to smoke from bushfires (2–3, 6–7, 12–15, 17 January and 6 February)
- 9 days due to a combination of smoke from bushfires and dust storms (1, 4–5, 8–9, 11, 23–24 January and 5 February)
- 4 days due to dust storms (10, 20 January, 1 February and 20 August)
- 1 day due to smoke from hazard reductions burns (6 September).
There were varying numbers of days with extreme air pollution across regions, ranging from 16 days in South West Slopes to 1 day in Lower Hunter and Central Coast. A summary for each region is given below (in descending order):
South West Slopes
South West Slopes had 16 days with extreme air pollution:
- 12 days due to bushfires (1–3, 5, 7–9, 12–15 January and 6 February)
- 2 days due to a combination of smoke from bushfires and dust storms (4 January and 5 February)
- 2 days due to dust storms (10 January and 1 February).
Southern Tablelands
Southern Tablelands had 11 days with extreme air pollution:
- 9 days due to bushfires (1–3, 5–6, 8, 11–12, 17 January)
- 1 day due to a combination of smoke from bushfires and dust storms (4 January)
- 1 day due to dust storms (23 January).
Sydney
Sydney had 9 days with extreme air pollution:
- 5 days due to bushfires (1, 5, 8, 11–12 January)
- 3 days due to a combination of smoke from bushfires and dust storms (4, 23–24 January)
- 1 day due to hazard reduction burns (6 September).
Central Tablelands
Central Tablelands had 6 days with extreme air pollution:
- 3 days due to a combination of smoke from bushfires and dust storms (1, 11, 23 January)
- 2 days due to bushfires (2, 5 January)
- 1 day due to dust storms (10 January).
North West Slopes
North West Slopes had 6 days with extreme air pollution:
- 3 days due to dust storms (20, 23 January and 20 August)
- 2 days due to a combination of smoke from bushfires and dust storms (9, 11 January)
- 1 day due to smoke from bushfires (5 January).
Illawarra
Illawarra had 5 days with extreme air pollution:
- 3 days due to smoke from bushfires (8, 11–12 January)
- 2 days due to a combination of smoke from bushfires and dust storms (23–24 January).
Mid-north Coast
Mid-north Coast had 3 days with extreme air pollution due to smoke from bushfires (5, 8–9 January).
Upper Hunter
Upper Hunter had 2 days with extreme air pollution:
- 1 day due to a combination of smoke from bushfires and dust (5 January)
- 1 day due to dust storms (11 January).
Newcastle Local
Newcastle Local had 2 days with extreme air pollution:
- 1 day due to smoke from bushfires (4 January)
- 1 day due to a combination of smoke from bushfires and dust storms (8 January).
Northern Tablelands
Northern Tablelands had 2 days with extreme air pollution:
- 1 day due to a combination of smoke from bushfires and dust storms (5 January)
- 1 day due to dust storms (20 August).
Central Coast
Central Coast had 1 day with extreme air pollution due to smoke from bushfires (8 January).
Lower Hunter
Lower Hunter had 1 day with extreme air pollution due to a combination of smoke from bushfires and dust storms (8 January).