In 2022, pollutant levels were within national standards 100% of the time in 9 of 16 NSW regions, including all the Sydney regions and the Illawarra, Central Coast, Lower Hunter, Upper Hunter population centres and Southern Tablelands (see NSW regional map). This is an improvement compared to 2021, when there were 4 regions where pollutant levels were within the standards 100% of the time.
The Northern Tablelands, Lake Macquarie, Riverina-Murray, Central Tablelands, North West Slopes and Mid North Coast regions, recorded levels within the national standards between 97.0% and 99.7% of the time.
The industry-funded Newcastle local network recorded levels within the standard 90% of time. This was primarily caused by sea salt spray raising PM10 levels at Stockton due to its proximity to the coast, particularly in the warmer months.
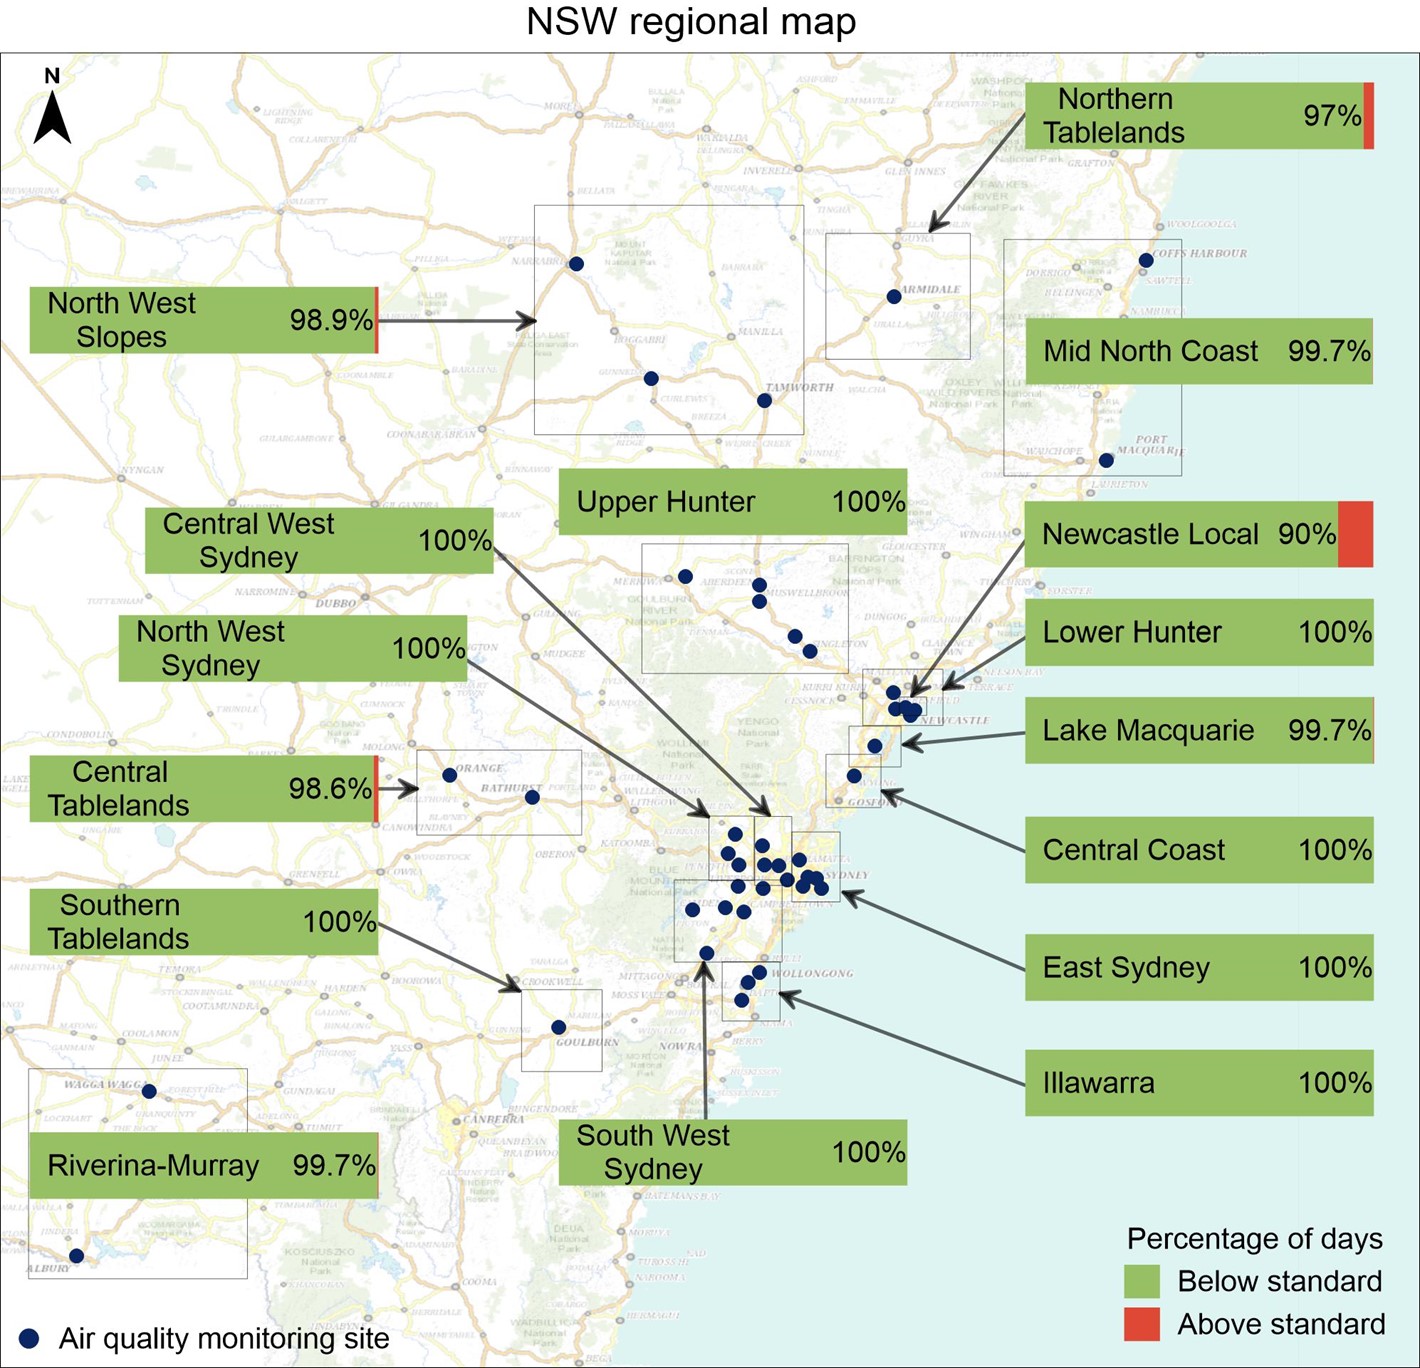
NSW regional map
Map with bar charts (shown in green), showing the percentage of days that pollutant levels in different regions were below air quality standards. The percentage of days in each region that pollutant levels were above the standards are shown in red.
Pollutant summary
- The network recorded 18 days in 2022 with one or more criteria pollutant over national standards at one or more metropolitan or regional population centres (see Days above national standards table and Pollutant exceedances graph), excluding Stockton. In 2021 there were 33 days with pollutant levels over the national standards.
- When including Stockton, the network recorded 54 days in 2022 with criteria pollutants over national standards, compared with 53 days in 2021.
- Where national standards were exceeded, it was most often due to elevated particle levels as either PM10 or PM2.5.
- Levels of ozone (O3) and carbon monoxide (CO) remained within national standards in 2022.
- There was one day with sulfur dioxide (SO2) levels over the national standard, recorded at Morisset in Lake Macquarie.
- There was one day with nitrogen dioxide (NO2) levels over the national standard, recorded at Coffs Harbour on the Mid North Coast.
- The Bradfield Highway roadside monitoring station (north of the Sydney Harbour Bridge, adjacent to one of the state's busiest roads), recorded an annual average NO2 level over the national benchmark.
Local industrial sources also affect particulate levels in the Hunter Valley. More information on the industry-funded Hunter Valley monitoring networks is found in the Hunter Valley and Stockton Focus areas pages.
Days above national standards for all pollutants, comparing 2022 and 2021
| Pollutant | 2022 | 2021 | |||
|---|---|---|---|---|---|
| Number of days over standard | Percentage of time within standards | Number of days over standard | Percentage of time within standards | ||
| PM10 | 38 | 90% | 40 | 89% | |
| PM10 (excluding Stockton) | 2 | 99% | 18 | 95% | |
| PM2.5 | 16 | 96% | 23 | 94% | |
| Ozone | 0 | 100% | 5 | 99% | |
| SO2 | 1 | 99.7% | 1 | 99.7% | |
| NO2 | 1 | 99.7% | 0 | 100% | |
| CO | 0 | 100% | 0 | 100% | |
Note: On any one given day, levels may have been over the standard for multiple pollutants, and at one or more air quality monitoring stations.

The bar chart compares 2022 and 2021 in terms of pollutant exceedances. It shows days when pollutants, such as PM10, PM2.5, ozone, and others, surpassed standards. PM10 data from Stockton was excluded.
Pollutant exceedances
The number of days with pollutant levels above the standards across New South Wales in 2022 compared with 2021. The pollutants include PM10, PM2.5, ozone, sulfur dioxide (SO2), nitrogen dioxide (NO2) and carbon monoxide (CO).
Event days
Exceedances of air quality standards for particles and ozone are deemed to be caused by exceptional events where data are adversely affected by bushfires, jurisdiction-authorised hazard reduction burning or continental-scale windblown dust (see Event days graph). Where the exceedance is caused by something else or where the cause cannot be determined, the exceedance is considered non-exceptional.
In 2022, the exceedance days observed were not impacted by bushfires, hazard reduction burns or continental-scale windblown dust, and therefore are all non-exceptional events.
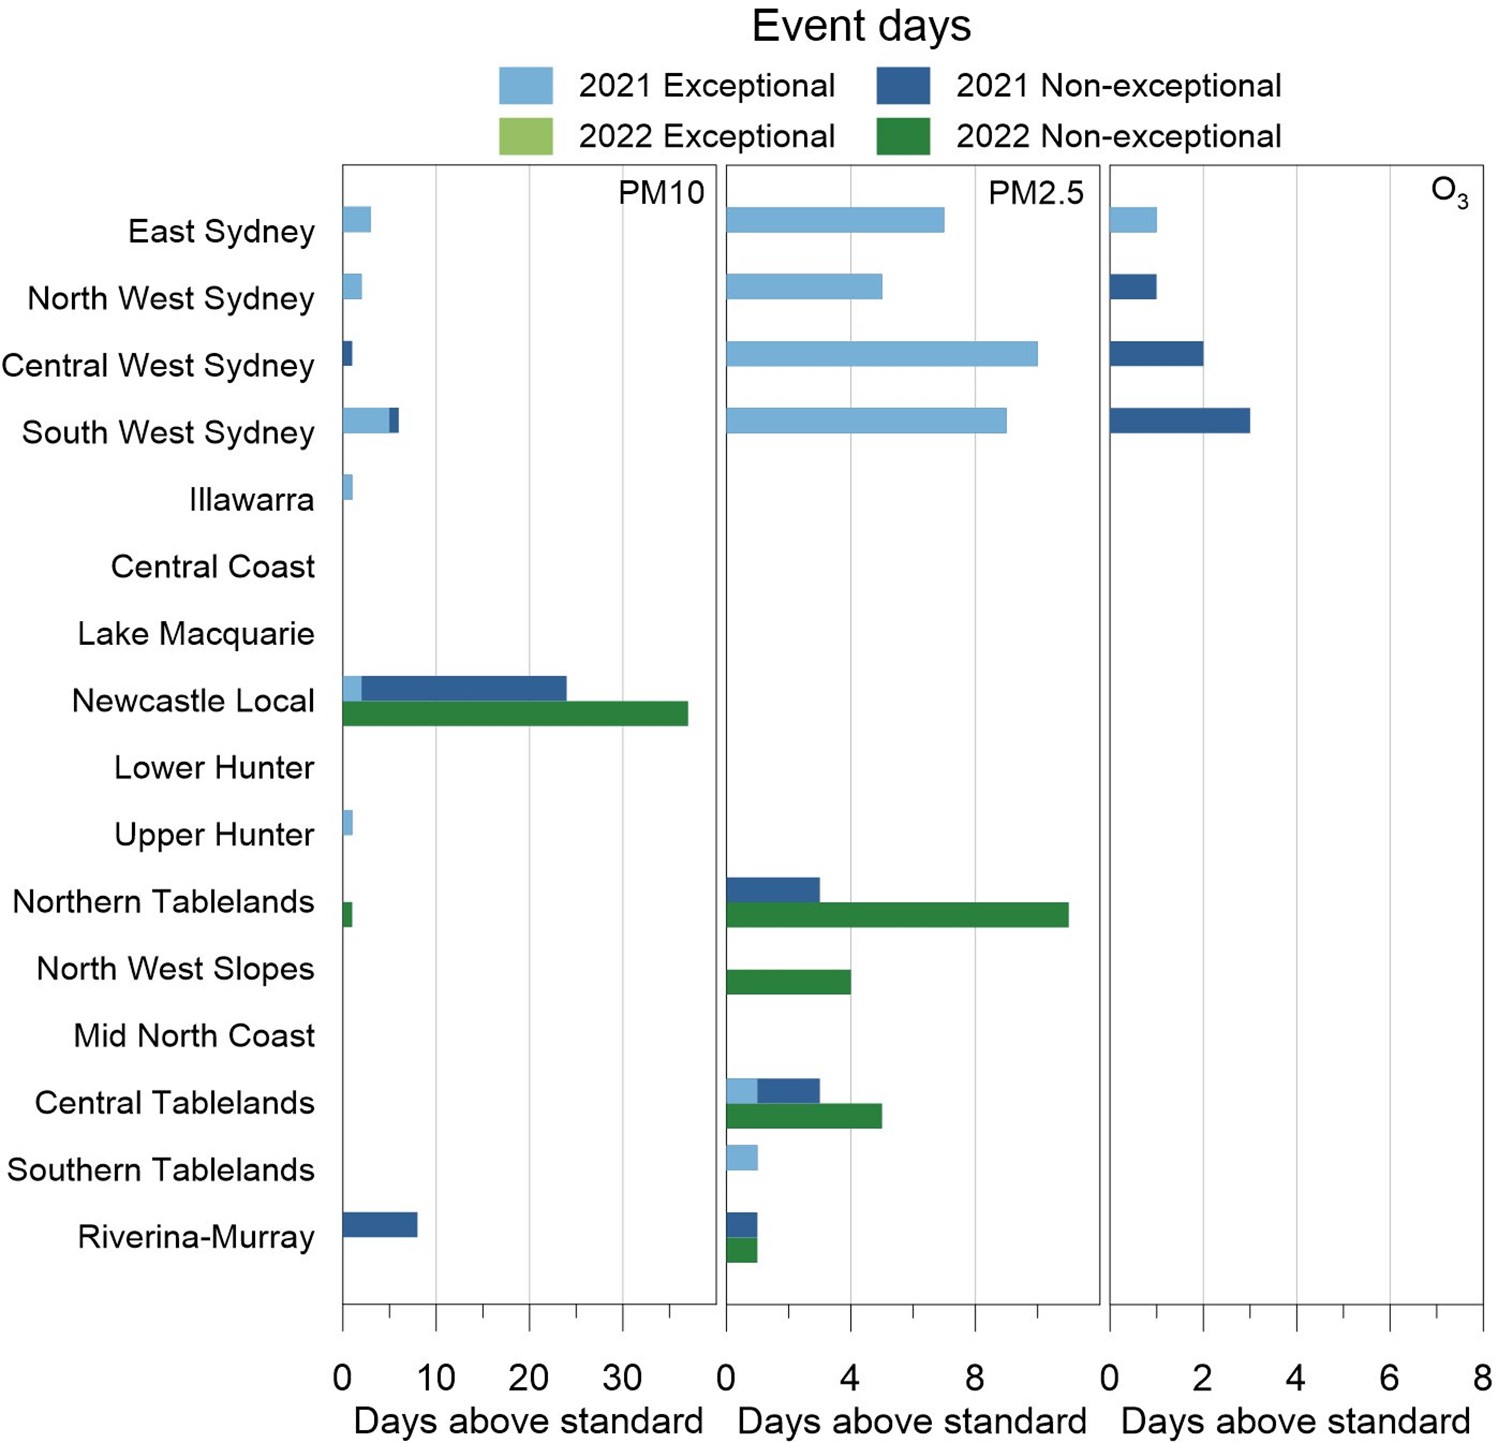
This graph shows event days. It compares exceptional and non-exceptional days in air quality regions in New South Wales for PM10, PM2.5, and O3 in 2022 vs. 2021.
Event days
Panel plot showing exceptional and non-exceptional event days in NSW air quality regions for PM10, PM2.5 and ozone (O3) in 2022 compared with 2021.
Note: Days exceeding standards are divided into exceptional and non-exceptional events. Exceptional events are those related to bushfires, hazard reduction burns and continental-scale dust storms.
Extreme air pollution days
Days with extremely poor air pollution levels are defined as those with pollution at levels exceeding twice the national standards for any pollutant.
In 2022, there were no days recording extremely poor air pollution, compared with 2 days for PM10 and 9 days for PM2.5 in 2021 (see Extremely poor air pollution days table).
| Pollutant | 2022 | 2021 |
|---|---|---|
| Days with extremely poor air quality | Days with extremely poor air quality | |
| PM10 | 0 | 2 |
| PM10 (excluding Stockton) | 0 | 2 |
| PM2.5 | 0 | 9 |
| Ozone | 0 | 0 |
| SO2 | 0 | 0 |
| NO2 | 0 | 0 |
| CO | 0 | 0 |
Attributed causes
Source attribution for event days graph presents the attributed causes of the exceedances of PM10, PM2.5 and ozone levels, by region. In 2022, all particle events were impacted by non-exceptional causes:
- PM10 exceedances were primarily affected by sea salt at Stockton in the Newcastle local region
- PM2.5 exceedances were primarily affected by woodsmoke from domestic wood heaters at Orange in the Central Tablelands, Armidale in the Northern Tablelands and Gunnedah in the North West Slopes. A single PM2.5 exceedance at Wagga Wagga North in the Riverina-Murray region was caused by agricultural burning.
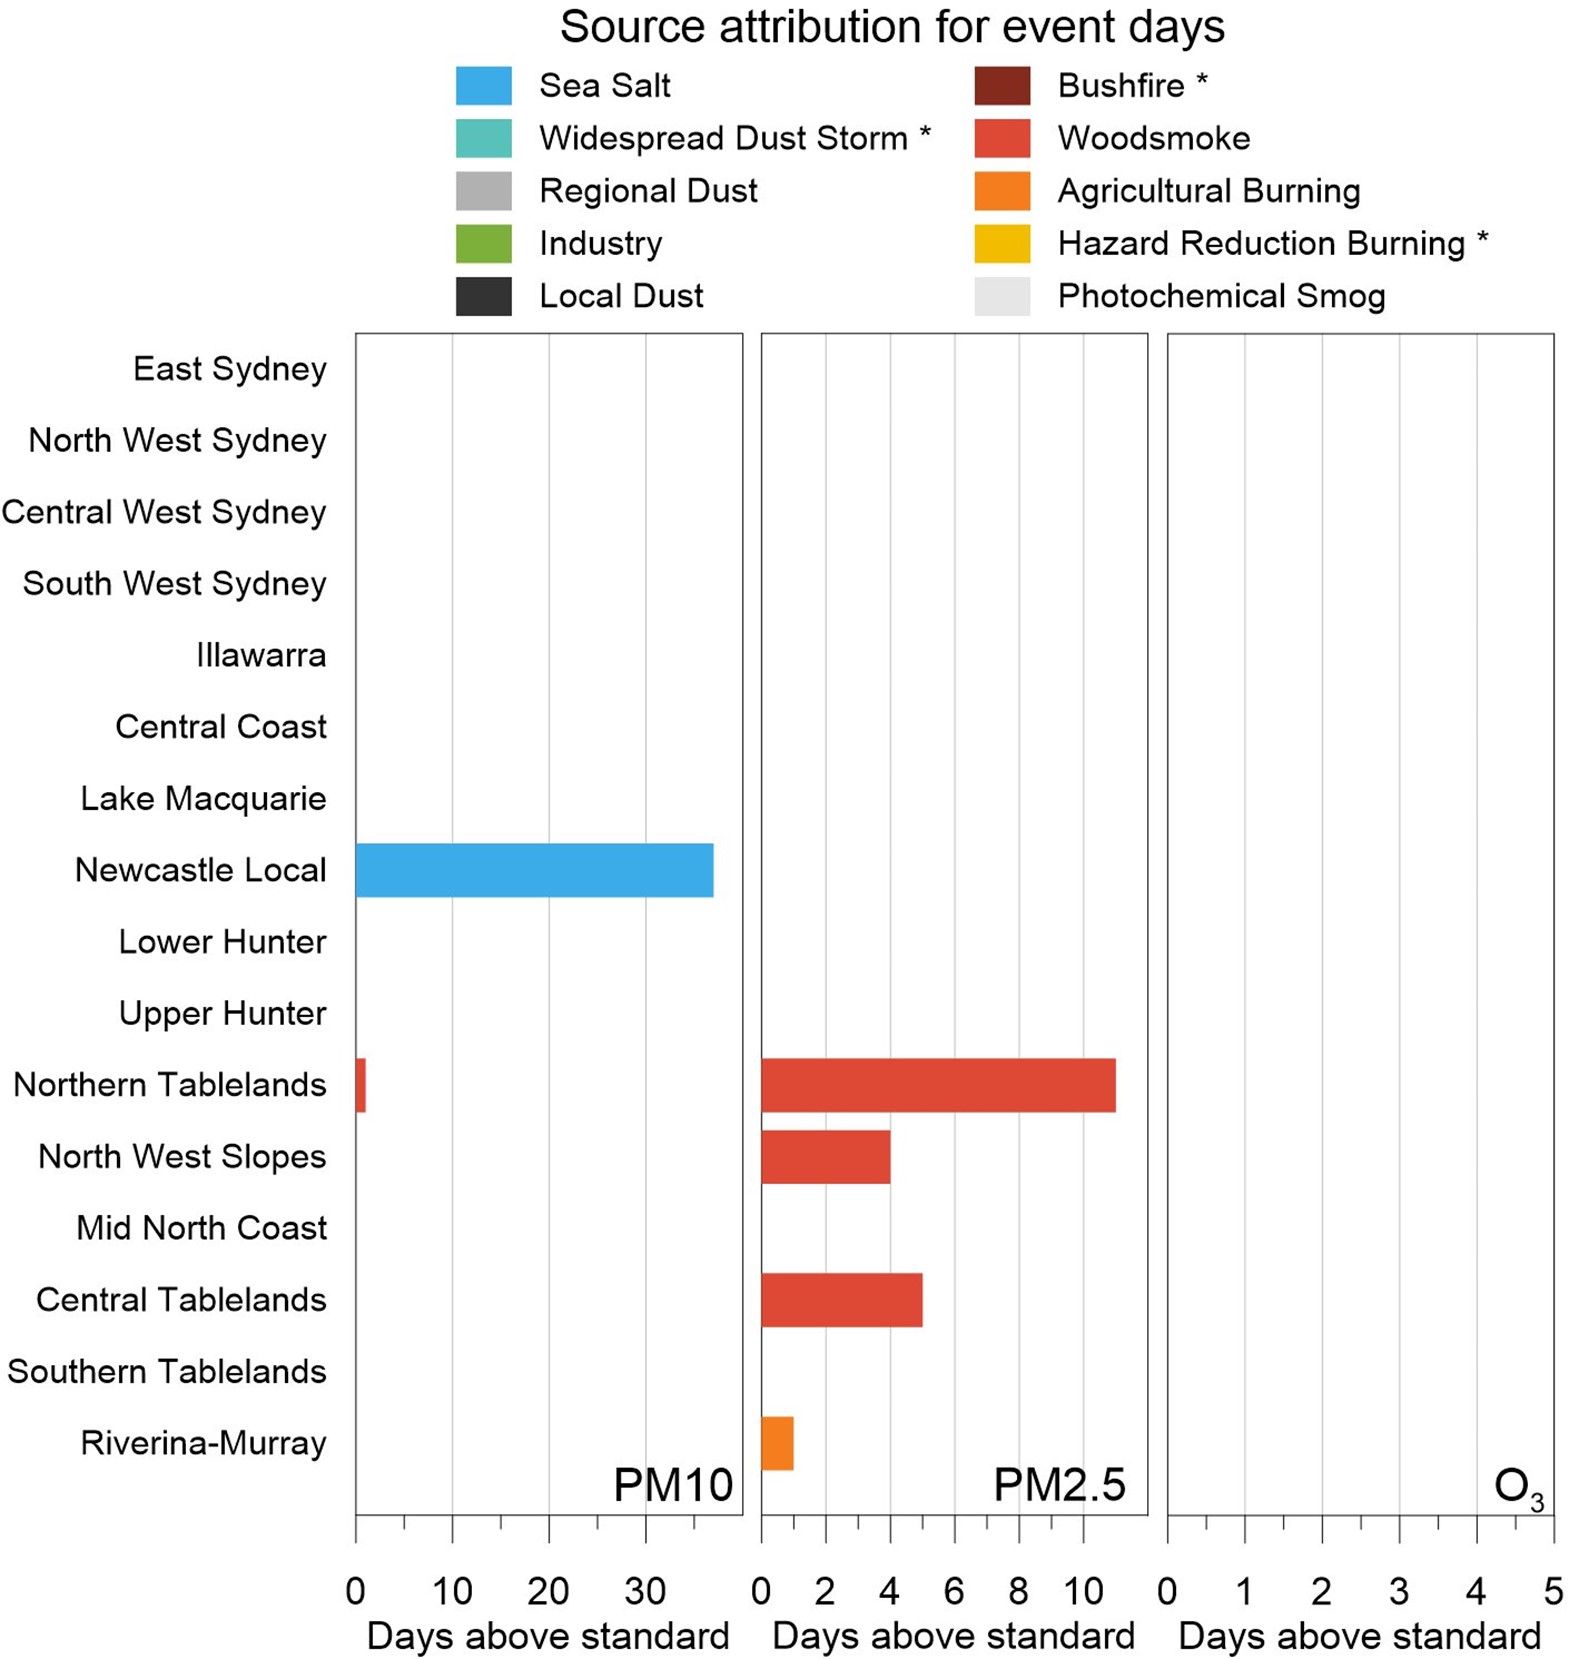
Graph showing the cause for exceedances of the PM10, PM2.5 and ozone (O3) standards across New South Wales for 2022. * Exceptional events.
* Exceptional events
Source attribution for event days
Panel plot showing the cause for exceedances of the PM10, PM2.5 and ozone (O3) standards across New South Wales for 2022. For ozone, there were no exceedance days in 2022.
Note: The attributed causes for event days vary year to year. The plot legend includes several source categories that are known to contribute to exceedance event days in New South Wales, but which were not observed during 2022.