- 2019 was by far the dustiest year since rural records began in July 2005. Several records were broken across the New South Wales rural air quality monitoring network (formerly DustWatch) in 2019. Many sites exceeded 200 hours of dust for the year, with several exceeding this in November 2019 alone. Sites in the western and north-eastern parts of the State came close to 1,000 hours of dust activity for the year (as shown in the map below). For more detailed month by month information refer to the 2019 DustWatch reports.
- A significant and rapid loss of groundcover since 2017 was a consequence of the prolonged and intense drought across NSW (as shown in the graph below). This contributed to the increased frequency, intensity and extent of dust storms in 2019, especially from September to November. Groundcover in December 2019 was the lowest across the State since satellite measurements began in 2001 (for more information refer to the DustWatch reports since January 2017).
- The widespread dust storms in 2019 were in part associated with the passage of cold fronts and low-pressure troughs travelling across NSW. These weather systems brought strong and turbulent winds that raised loose soil particles across parts of South Australia, western Victoria and western NSW. Westerly to south-westerly winds transported suspended dust particles over long distances to eastern parts of NSW. Across the rural network stations, there was an average of 69 hours of strong winds above 40 kilometres per hour recorded in November, resulting in a peak monthly average of 94 hours of dust activity (see graph below).
- Dust storms had a major impact on air quality throughout 2019, both in inland NSW and across the populated coastal areas. Historically, widespread dust storms were more frequent in late winter to spring. However, 2019 also saw large dust storms in summer months and early autumn.
NSW air quality monitoring network
The NSW air quality monitoring network data provide the following highlights:
- At NSW regional centres, dust storms contributed to significantly elevated daily PM10 levels, with the following days exceeding the national standard:
- Wagga Wagga North in the South-west Slopes was the most affected regional station in the network. The station recorded more than 40 days over the PM10 standard due to dust activity (with another 10 days impacted by dust storms along with smoke from bushfires).
- 11 days at Albury in the South-west Slopes
- 27 days at Tamworth, 22 days at Narrabri and 19 days at Gunnedah in the North-west Slopes
- 18 days at Bathurst and 13 days at Orange in the Central Tablelands
- 15 days at Armidale in the Northern Tablelands
- 3 days at the new Goulburn monitoring station in the Southern Tablelands (established in November 2019).
- In the Greater Metropolitan Region (GMR), dust storms contributed to daily PM10 levels above the standard on at least:
- 8 days at one or more stations in the Sydney region
- 4 days at one or more sites in the Illawarra
- 4 days in the Central Coast
- 12 days at one or more sites in the Lower Hunter.
- Dust activities contributed to PM10 daily levels above the national standard during the bushfire emergency period (October – December) on 3 days, 27-28 November and 2 December 2019.
NSW rural air quality monitoring network
The NSW rural air quality monitoring network incorporates over 35 stations in rural NSW and across the border into South Australia and Victoria. These stations provide indicative monitoring of airborne particulate matters, as PM10 and PM2.5 (particles less than 10 and 2.5 micrometres in diameter, respectively) and total suspended particles (TSP). The indicative monitoring does not comply with any Australian Standards and PM10 and PM2.5 data recorded are not intended for comparison with national air quality standards for PM2.5 or PM10.
The NSW rural air quality monitoring network recorded elevated particle levels due to dust activities. For example, during the 2 largest dust storms in south-western NSW in 2019, the following occurred on 7 May and 21 November, respectively:
- a maximum hourly PM2.5 level of 2500 µg/m3 was recorded at Buronga on 7 May at 6pm
- a maximum hourly PM10 level of 11,800 µg/m3 was recorded at Buronga on 21 November at 12pm
- a maximum hourly TSP level of 13,500 µg/m3 was recorded at Buronga on 21 November at 12pm.
During the same event in November, high maximum particle levels were also observed in other western NSW stations such as Ivanhoe, Broken Hill and Lake Victoria.
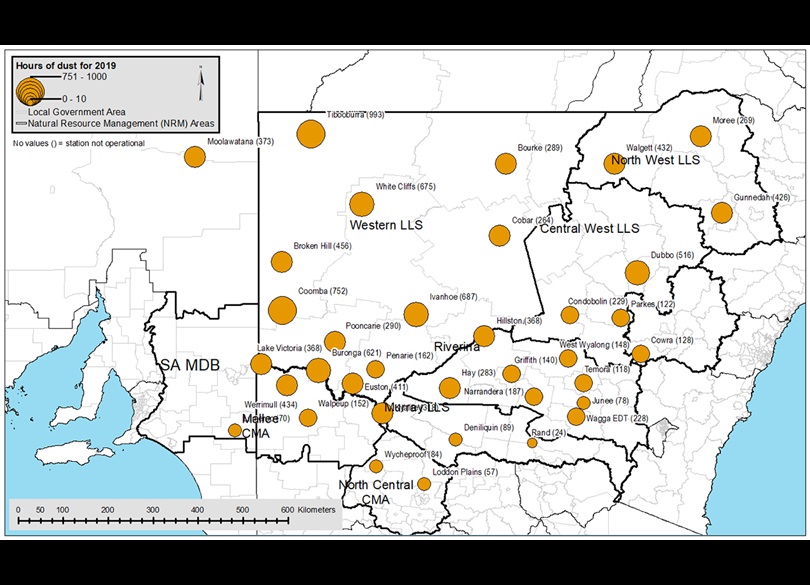
Hours of dust activity recorded in 2019 across the NSW rural air quality monitoring network, showing close to 1,000 hours in western and north-western parts of the State (numbers in brackets)
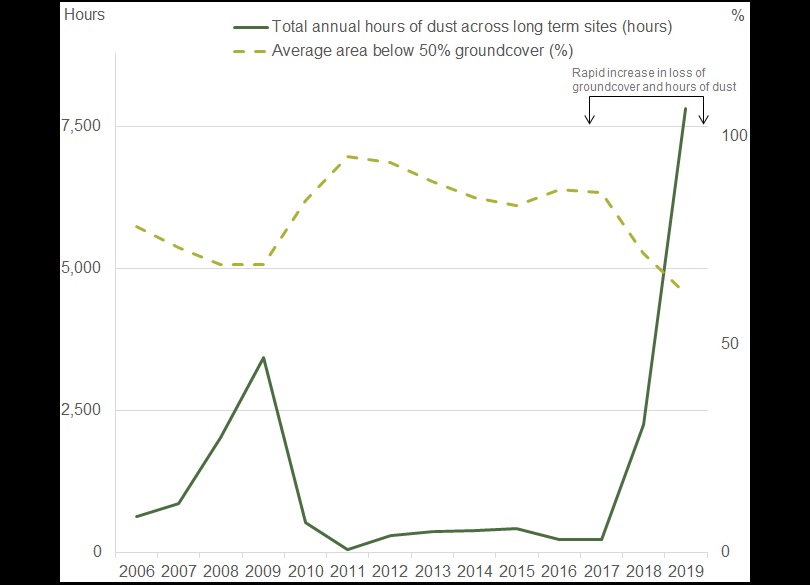
Historical trend in annual hours of dust.
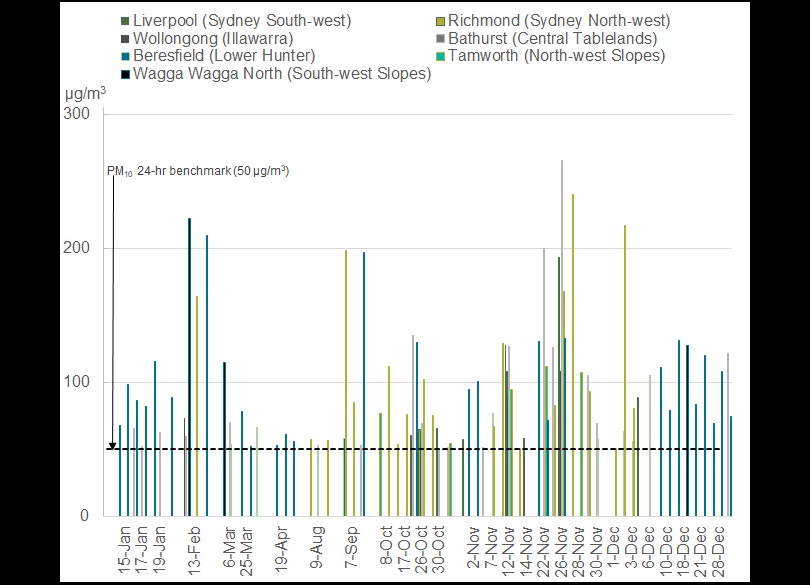
2019 daily averages for PM10. Exceptional events are attributed to dust storms or a combination of dust and smoke.
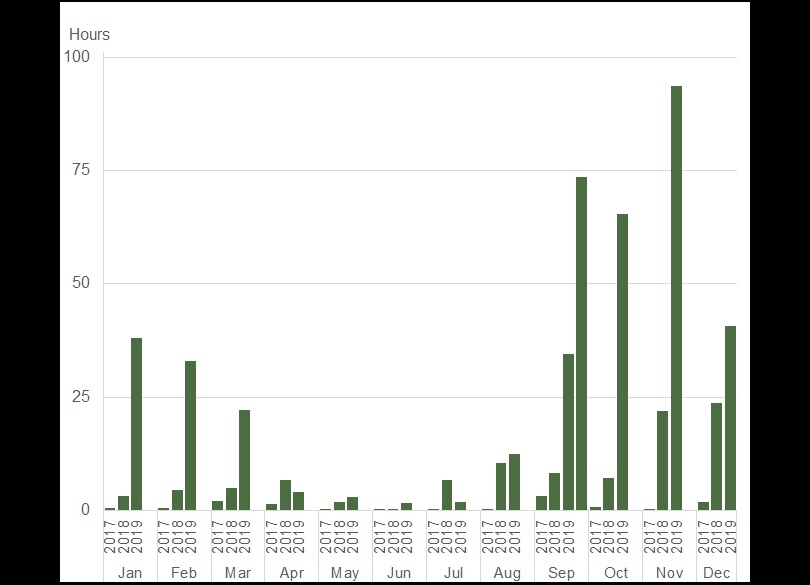
Average hours of dust activity per month from 2017 to 2019.