Monitoring and analysis
Our analysis of smoke monitoring data investigated how our air quality monitoring methods and instruments were affected by the extreme levels of pollution during the NSW bushfire period in spring summer 2019–20. Episode analyses focused on the extent and intensity of high pollution events across our monitoring networks.
Key points
- A review of the impact of smoke from bushfires and hazard reduction burns on air quality in Sydney and surrounding regions over the past 20 years found that the spring-summer bushfires of 2019–20 was the worst event on record in terms of the intensity and duration of smoke impacts on visibility and fine particle levels.
- The community-initiated Blue Mountains Air Watch project found that the highest particle levels during the 12-month study period, from June 2019 to May 2020, were recorded at Katoomba and Lithgow during the bushfires period in spring–summer 2019–20.
- Our instrument performance testing found that lightweight, solar powered indicative particle monitors performed well as indicators of near real time smoke levels, compared to standard compliance particle monitors.
- A review of particle concentrations observed across the NSW Rural Air Quality Monitoring Network and modelling of particle pathways was undertaken for an event in early January. It found that south-easterly winds transported smoke from extensive fires in south-east Australia, across rural inland New South Wales, over distances of greater than 1000 kilometres.
Case studies
Synopsis
- Nephelometers have been in operation at some stations in the NSW Air Quality Monitoring Network. Readings from optical nephelometer monitors are referred to as visibility data in our network, being considered good indicators of smoke impact. A high nephelometer reading typically means a high reduction in visual distance, due to high concentrations of fine particle pollution.
- This analysis compared visibility readings over the last 20 years with those during the bushfire period in spring-summer 2019–20. The results show that the highest nephelometer (visibility reduction) levels were often associated with smoke impacts due to bushfires and hazard reduction burns. In particular, the spring-summer 2019–20 bushfires were associated with the highest nephelometer readings on record, indicating the highest levels of fine particle pollution due to smoke and the greatest reductions in visibility, for the longest period over the last 20 years.
- The analysis highlights that nephelometer readings from the network provide a comprehensive long-term dataset for analysing historical trends in fine particle pollution.
Synopsis
- Our emergency air quality monitoring response applied a controlled experiment approach. We tested the performance of our compliance and indicative monitoring instruments, co-located at the Coffs Harbour bushfire air quality monitoring station.
- Fine particles as PM2.5 are the pollutant of most concern when assessing the impact of smoke on human health. This is because fine particles are produced in high amounts from combustion processes including bushfires. The fine particles can travel deep into the lungs and the blood stream. Long term exposure to fine particles can cause heart and lung disease. Short term exposure may exacerbate symptoms of these diseases.
- Our findings compared the results of 3 instruments:
- particles as PM2.5 using standard approved methods (TEOM-FDMS instruments),
- optical methods for measuring changes in visibility (nephelometers) due to particles
- lightweight solar powered indicative monitors used in the rural and bushfire air quality monitoring networks.
- The two indicative particle monitors were found to respond similarly and linearly comparable to the PM2.5 standard instruments. These are considered appropriate tools for reporting smoke pollution and providing a basis for associated health messages for PM2.5.
Synopsis
This case study investigated hourly average particle concentrations observed across the NSW Rural Air Quality Monitoring Network from 5 to 7 January 2020.
High levels of fine smoke particles were indicated by high hourly PM2.5 levels above 100 micrograms per cubic metre (µg/m3), as well as high ratios of PM2.5 concentrations compared to PM10.
Fine smoke particles were measured in regions across the Network, for up to 48% of hours in the south-east, up to 29% of hours in north-west and up to 10% of hours in western regions.
Modelling of particle pathways demonstrated that south-easterly winds transported smoke from extensive fires in the south-east, across rural inland New South Wales to the north-west for more than 1,000 kilometres.
Synopsis
- The Blue Mountains and Lithgow Air Watch project was a 12-month community-initiated research project, from 1 June 2019 to 31 May 2020, supported by the NSW Environment Protection Authority and the NSW Department of Planning and Environment as well as local stakeholders.
- The project included 12 low cost air quality sensors, known as KOALAs (Knowing Our Ambient Local Air-Quality sensors), located in communities at Katoomba, Lithgow, Springwood and Wentworth Falls.
- The study found that the highest particle levels during the 12-month study period were recorded at Katoomba and Lithgow during the bushfires period in December 2019 and January 2020.
Go to: Blue Mountains Air Watch
Modelling and forecasting
Our smoke modelling and forecasting work brings together air quality measurements, air emissions inventories, air quality modelling and tools for data analysis, to classify the air quality over a given airshed. This allows us to predict more realistically the dynamic behaviour of smoke and dust plumes in near-real time. When air pollution levels are predicted to exceed health standards, we provide timely alerts to the public and emergency response agencies.
Key points
- We adapt and apply a wide variety of modelling tools to estimate the relationship between pollution sources and their effects on ambient air quality and health. This allows us to generate fit-for-purpose responses for managing air pollution in the context of New South Wales.
- Inputs for air quality models are updated continually to accommodate the varying environmental conditions in New South Wales. This involves continuous improvement in emissions inventories and meteorological inputs, as well as advances in modelling air pollutant behaviours - such as chemical transformation, transport and deposition.
- Our air quality modelling capability supports the NSW air quality forecasting operations, policy development and research activities. This allows us to assess the potential health impacts and the resulting cost implications associated with pollution incidents or selected scenarios, facilitating decision making in air quality and public health management, such as emissions reduction strategies and air pollution emergency management.
- Data generated in our air quality monitoring and modelling activities provide a valuable resource for evidence-based decision making in air quality management and assessment. We work with science partners to develop appropriate methods and tools to facilitate application of our data for different end user needs.
More detail
- We established the NSW Air Quality Forecast Framework in 2014. Our project partners include the NSW Environment Protection Authority (EPA), the NSW Ministry of Health, the NSW Rural Fire Service (RFS), CSIRO and universities.
- A reliable and accurate air quality forecasting system plays an important role in regional air quality management. We currently provide next-day air quality predictions for particles and ground level ozone over the Sydney Metropolitan Region. We are extending this forecasting capacity progressively to the cover the NSW greater metropolitan region and major regional areas.
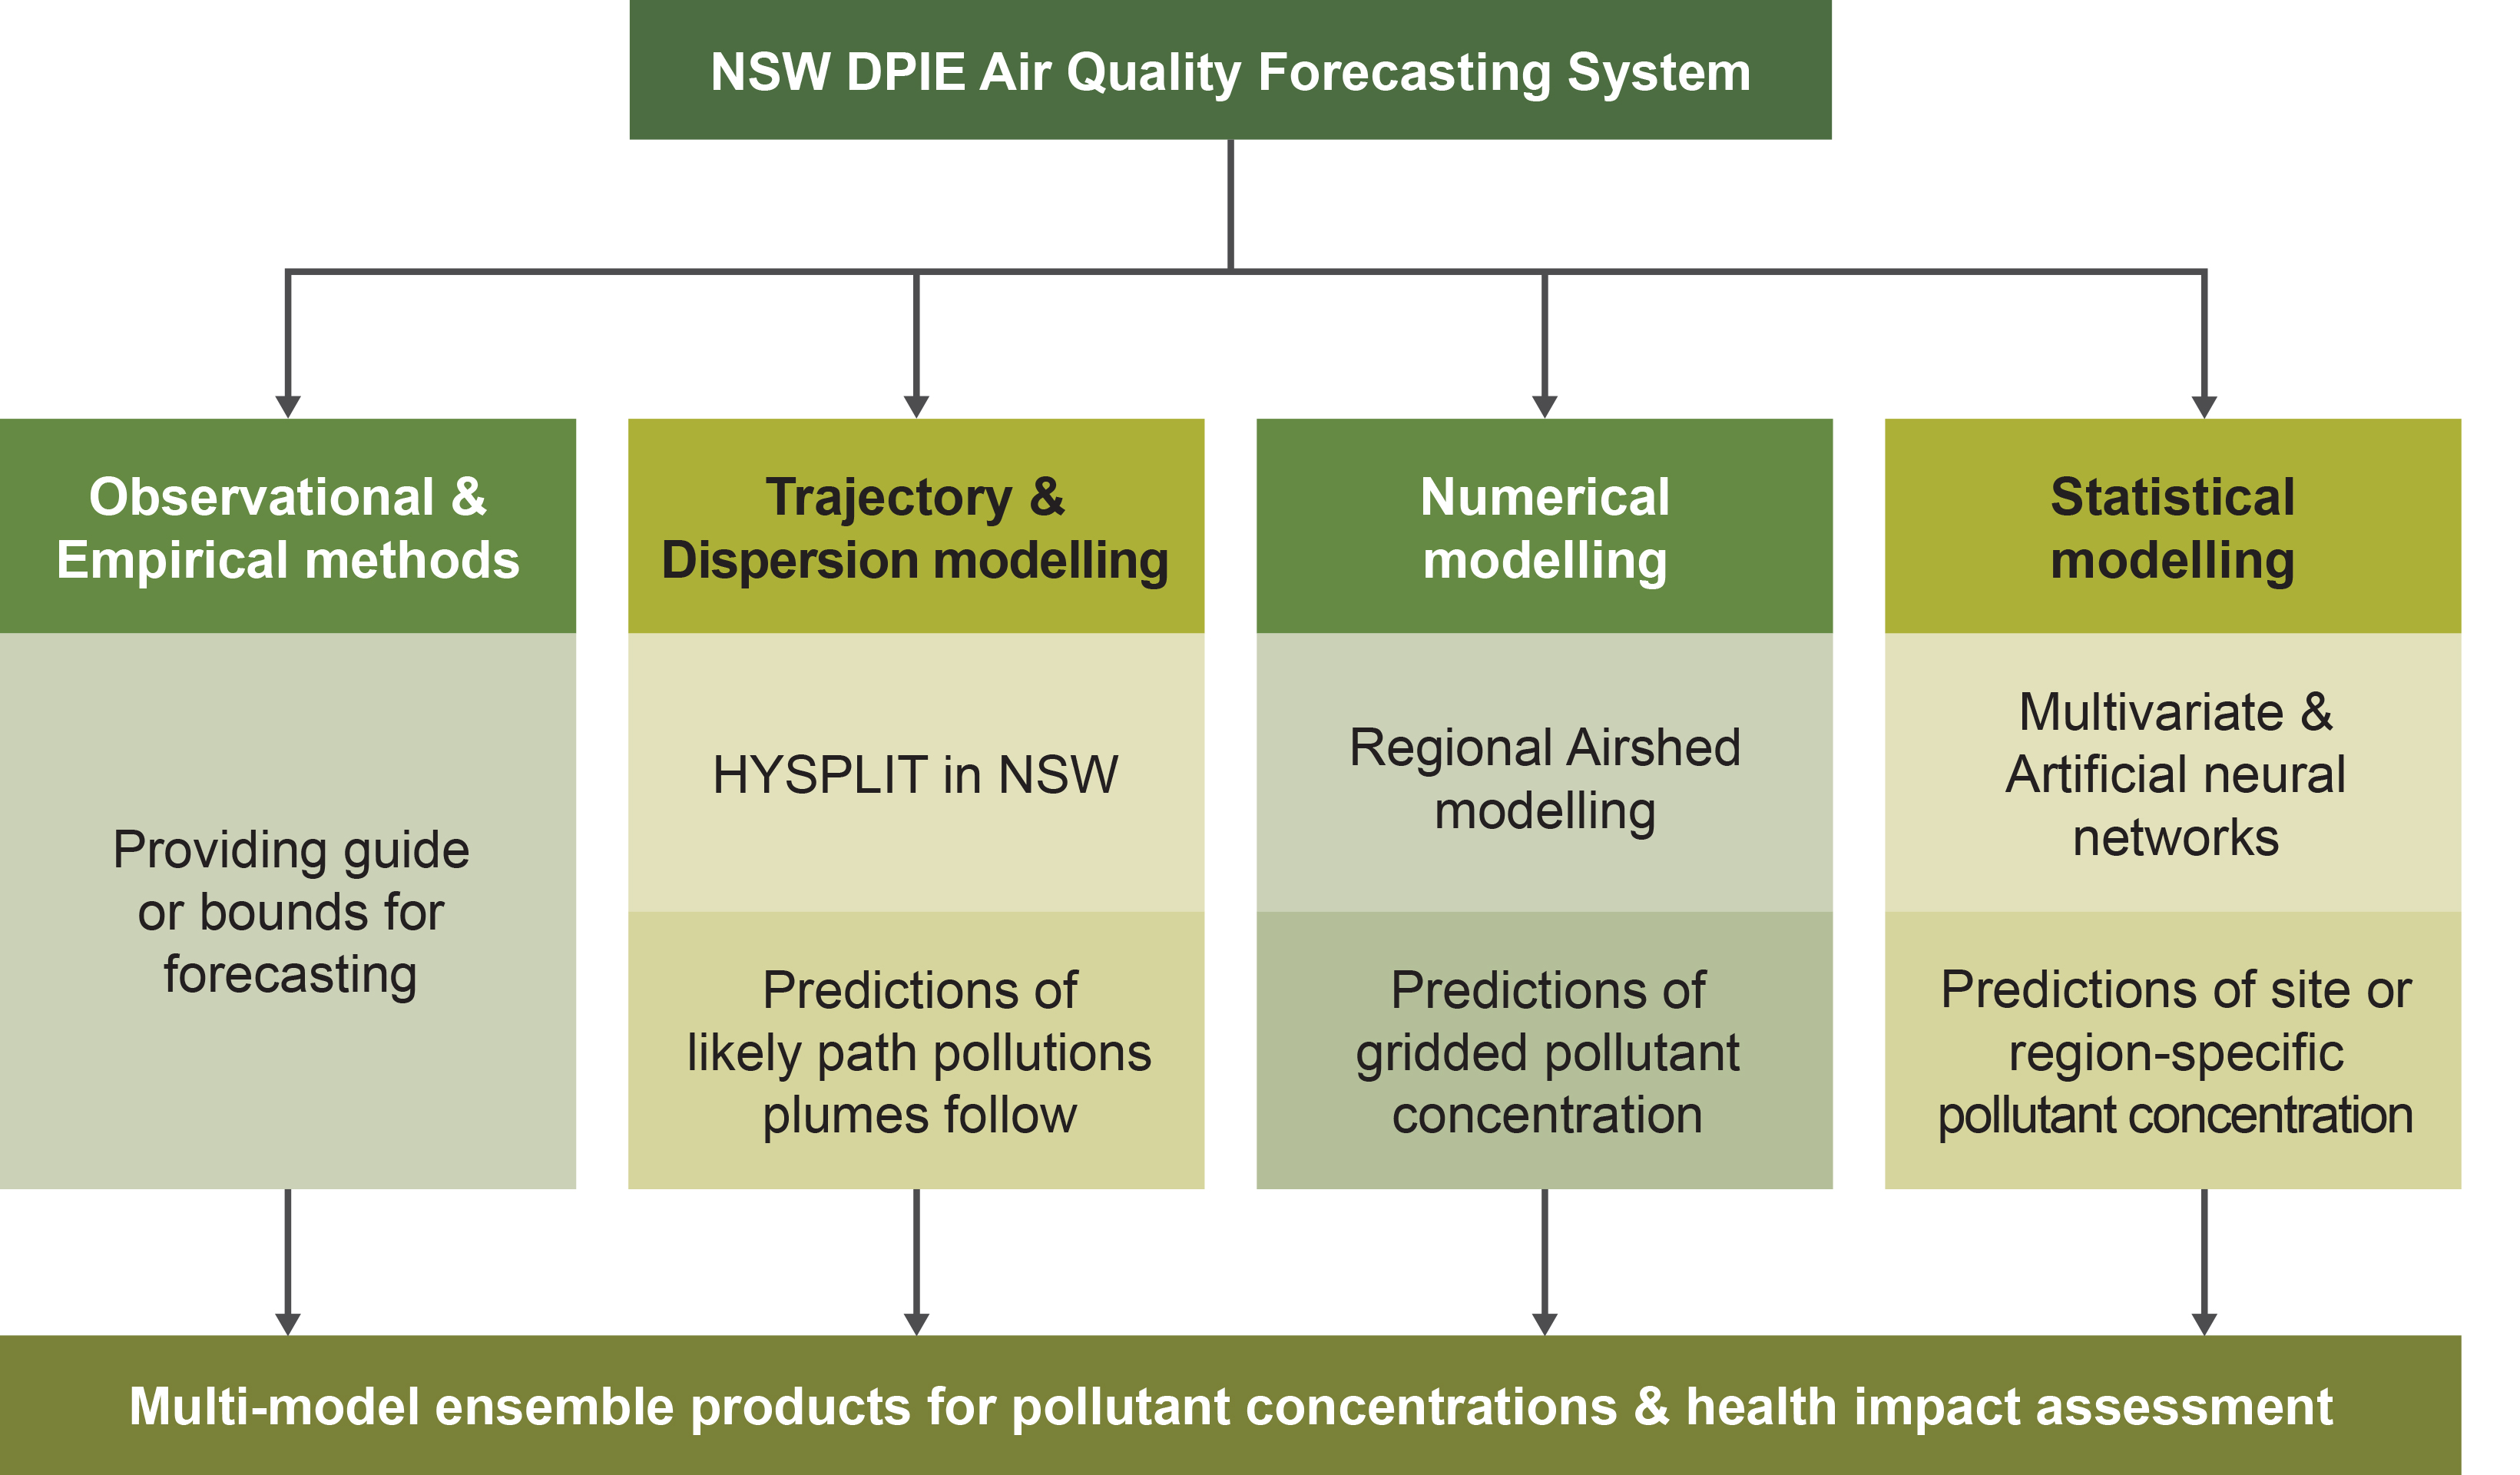
- The NSW Air Quality Forecasting System is based on a suite of state-of-the-art models, tailored to run for New South Wales (refer to the diagram below). This system is crucial to the state's emergency responses (for example, during bushfires and regional dust storms) and is critical in providing timely alerts to public subscribers when air pollution levels are predicted to exceed health standards.
- Emissions from human and natural sources are all around us and their impacts on our health, economy and environment are vast. Estimates of emissions from multiple sources are required as inputs for air quality management tools, such as forecasting systems, health impact assessment studies and alert systems.
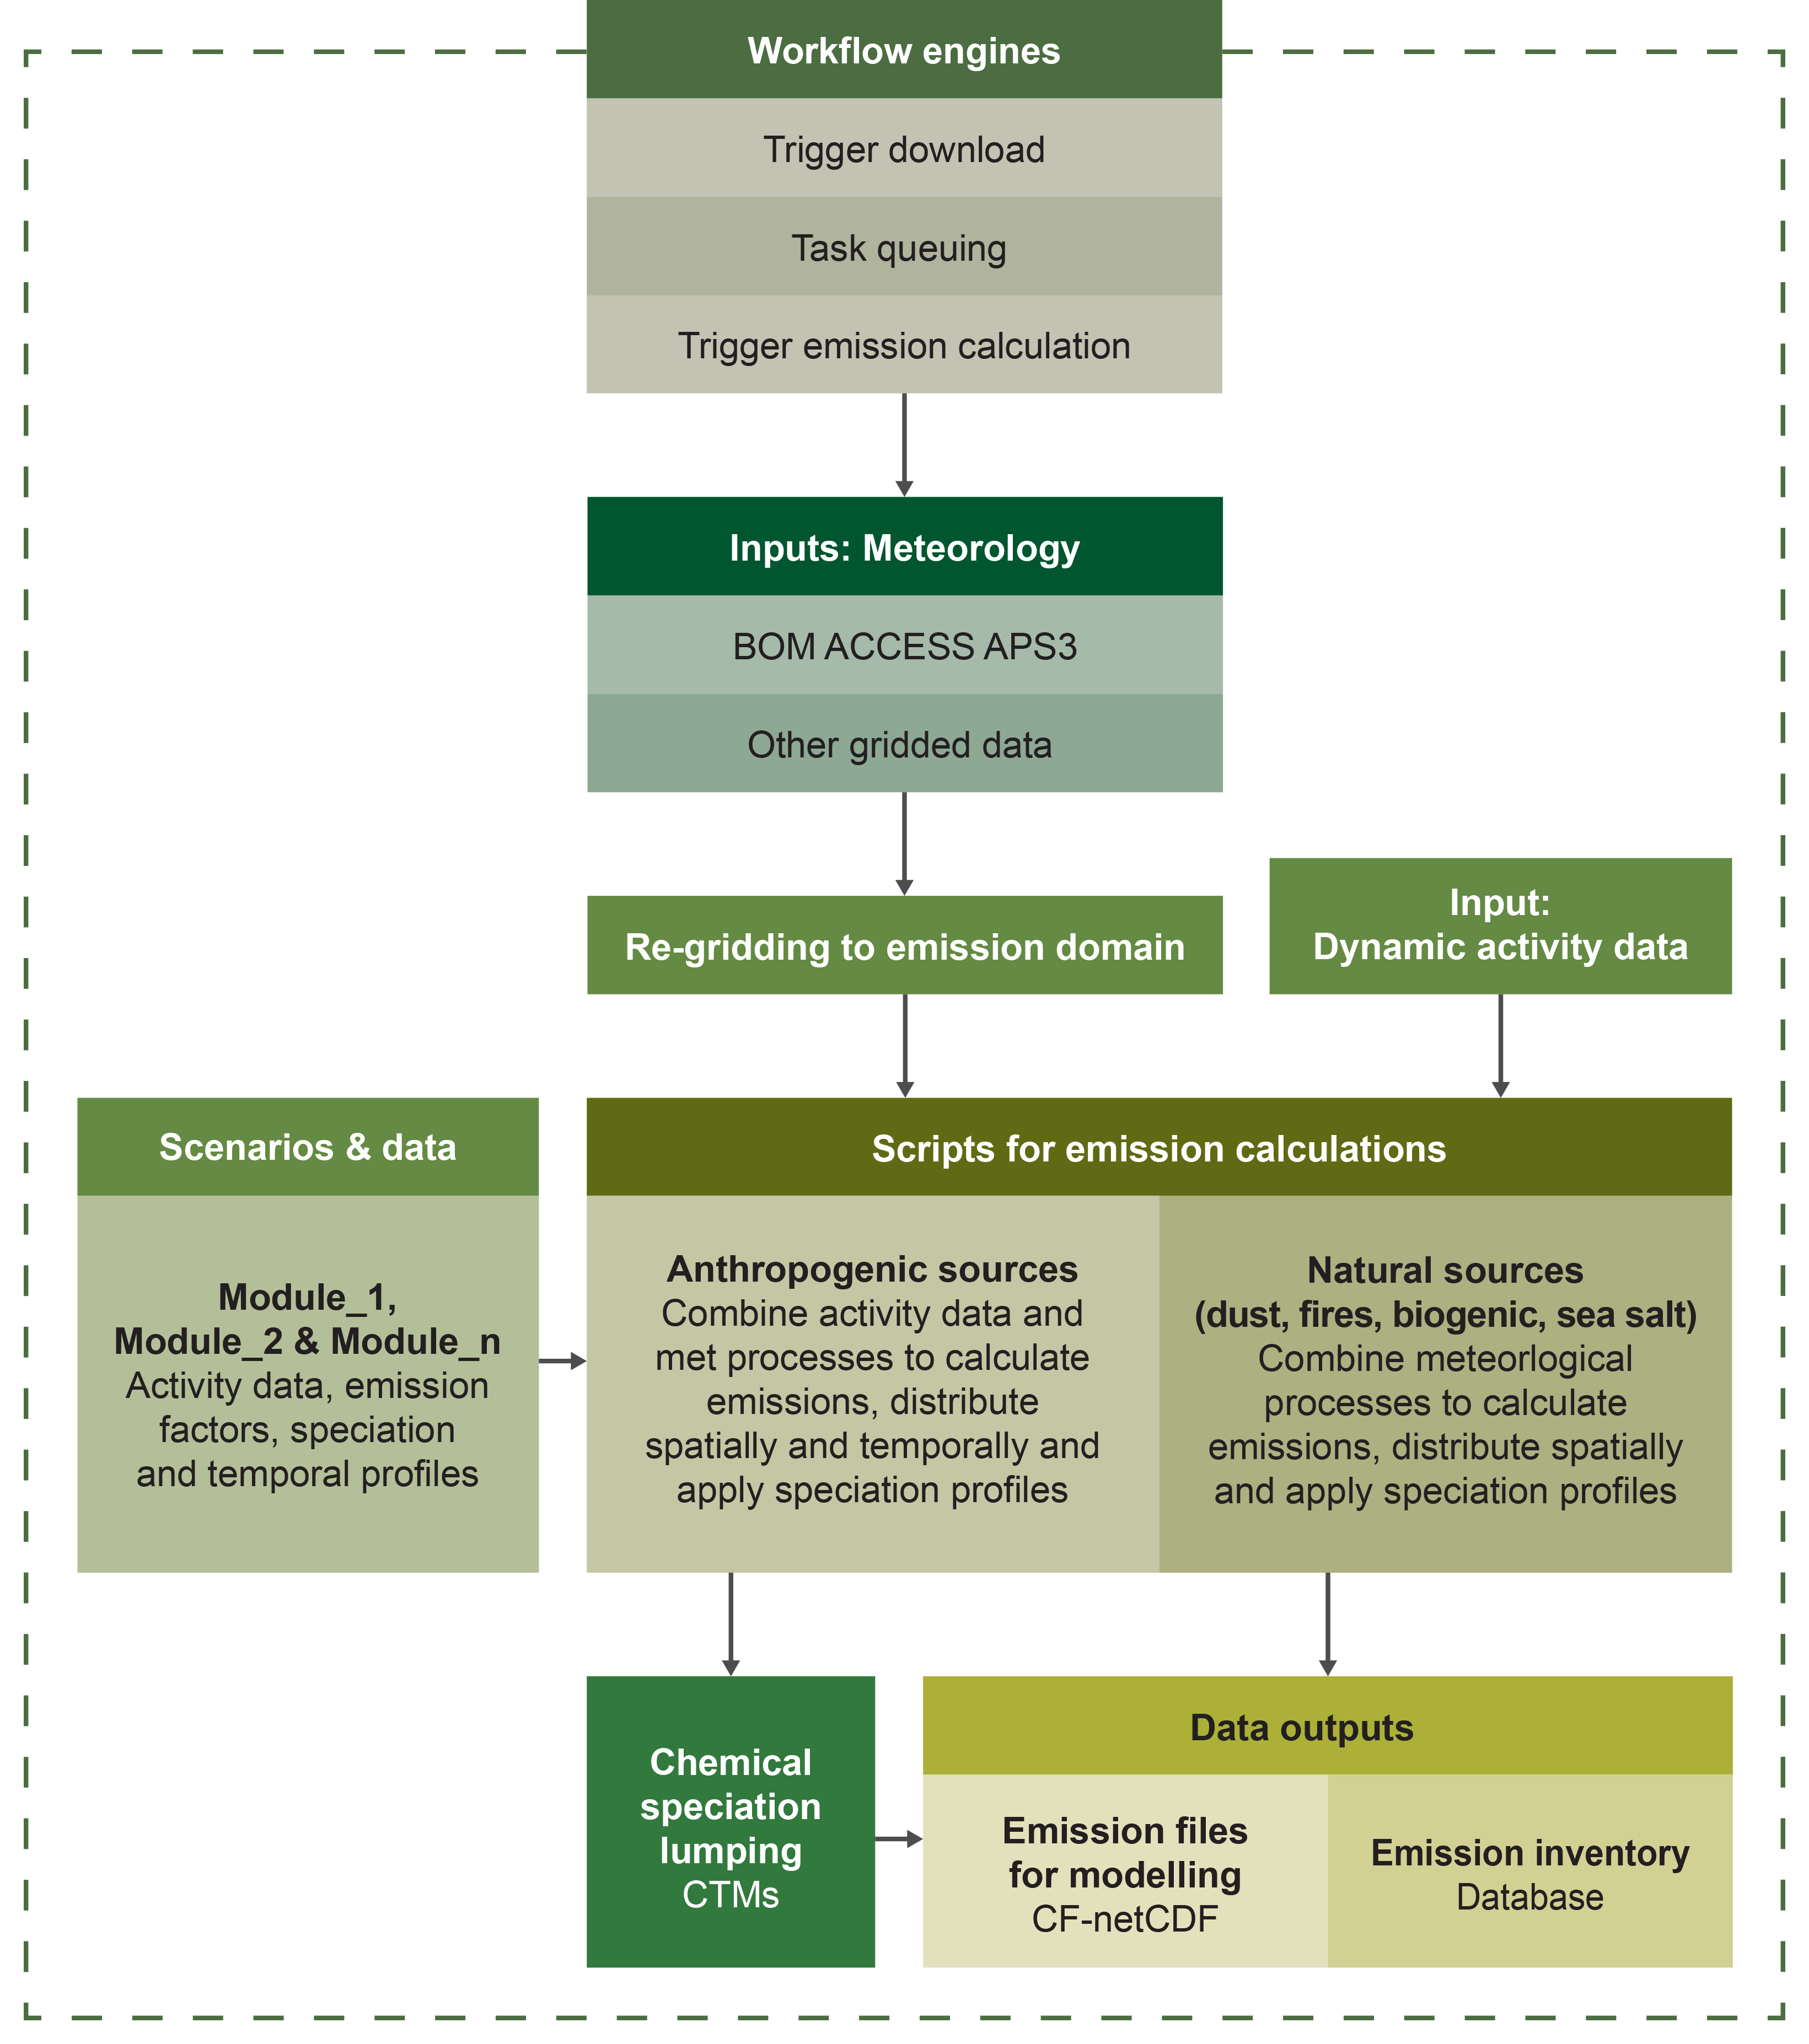
- Traditionally, information about emissions was assembled into static inventories. Our modular emissions modelling system (MEMS), developed by the Department of Planning and Environment's Climate and Atmospheric Science Branch, attributes emissions to rapidly changing pollutant sources – such as bushfires and dust storms, as well as pollutants from motor vehicles and industrial activities. MEMS supports near-real-time tracking of activities associated with emissions and forecasting of emissions ahead of time. Both the engineering and science behind MEMS are unique globally, placing New South Wales at the forefront of service providers worldwide, while catering to the specific needs and priorities of NSW communities.
- The accuracy of emissions inventories is a key component to effectively manage air quality and generate projections for future developments. MEMS generates high-resolution and dynamic emission estimates for anthropogenic and natural sources across New South Wales. Emissions data produced by MEMS supports a variety of projects, including air quality forecasting.
- Our current research included modelling of the dispersion of smoke from the 2019–20 summer wildfires on the east coast of Australia from November 2019 to end of January 2020, and analysis of the impacts across the states of Queensland, New South Wales, Victoria and South Australia. Our study found that smoke transported pollutants not only across south-eastern Australia to New Zealand, but also across the Pacific Ocean to South America. At the height of the wildfires, smoke plumes were injected into the stratosphere, up to a height of 25 kilometres, and transported across the globe.
- The extent of the wildfires, pollutant transport and impacts on air quality and health of the exposed population in New South Wales was analysed using meteorological and air quality simulation. The study used the atmospheric model WRF-Chem, a weather research and forecasting model coupled with atmospheric chemical reactions. The model simulated the emission, transport, mixing, and chemical transformation of trace gases and aerosols simultaneously with the meteorology. Results from WRF-Chem were validated against NSW air quality monitoring data collected during the bushfire period and remote sensing data from MODIS and CALIPSO satellites.
- The results showed that WRF-Chem, using a Fire Emission Inventory (FINN) from NCAR, performed reasonably well in predicted the dispersion and transport of pollutants and the predicted concentrations of PM2.5 and other pollutants from wildfires, when compared with ground-based and satellite data. The impacts on health endpoints were estimated, for example, for mortality, respiratory and cardiac diseases, and hospitalisations. The estimated health impacts were comparable to those in a previous study based only on observation data. The results in this study provided comprehensive detail on the predicted health impacts, spatially and temporarily, associated with the NSW bushfire season 2019–20.

The NSW Air Quality Forecasting System is based on a suite of state-of-the-art models. For example: (1) Trajectory and dispersion modelling is used to forecast the likely path that air pollution plumes may follow. The model HYSLPIT in NSW (Hybrid Single-Particle Lagrangian Integrated Trajectory model) has been tailored for New South Wales to track particle pollution pathways. It combines observed air quality measurements and meteorological forecasts. (2) Numerical and statistical models use mathematical techniques to simulate the physical and chemical processes in the atmosphere that affect air pollutants as they disperse and react. These modelling tools work together to generate predictions of varying levels of air pollutants across the study area.

Our modular emissions modelling system (MEMS) combines various modules or components for estimating emissions of pollutants, from a variety of anthropogenic and natural sources, including dust storms and fires. Scripts and tools are continually improved to further process the emissions into the format needed for air quality modelling. MEMS’ improved smoke and dust emissions modelling components generate estimates of the variable emissions of particles during bushfires and dust storms. This allows air quality forecasting to model the dynamic behaviour of smoke and dust plumes more realistically and in near-real time.