National standards for PM10
- Annual average – 25 micrograms per cubic metre of air (25 µg/m3)
- Daily average – 50 micrograms per cubic metre of air (50 µg/m3)
Annual average PM10 levels
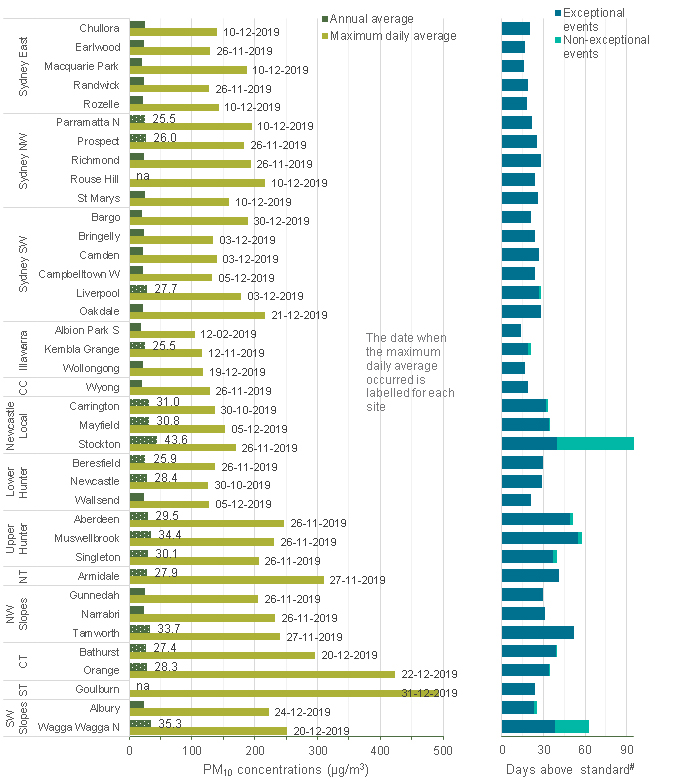
During 2019, annual average PM10 levels met the national standard at 19 of the 36 sites with available annual average data, located within the Sydney, Illawarra, Central Coast, Lower Hunter, North-west Slopes and South-west Slopes regions.
In 2019, 17 of the 36 sites with available annual average data in New South Wales exceeded the national PM10 annual average standard. These occurred at
- Liverpool, Parramatta North and Prospect in the Sydney region
- Kembla Grange in the Illawarra
- Beresfield and Newcastle in the Lower Hunter
- Stockton, Carrington and Mayfield in the Port of Newcastle
- Aberdeen, Muswellbrook and Singleton (the 3 large population sites) in the Upper Hunter
- Tamworth in the North-west Slopes
- Armidale in the Northern Tablelands
- Orange and Bathurst in the Central Tablelands
- Wagga Wagga North in the South-west Slopes region.
Annual average PM10 levels ranged from 19.5 µg/m3 at Albion Park South in the Illawarra region to 43.6 µg/m3 at Stockton in the Port of Newcastle during 2019.
There was an increase in annual average PM10 concentrations at all stations, and an increase in the number of sites exceeding the annual average standard in 2019, compared with 2018. In 2018, the annual average PM10 levels ranged from 14.3 µg/m3 at Narrabri in the North-west Slopes region to 38.7 µg/m3 at Stockton in the Port of Newcastle, with 5 sites exceeding the annual average PM10 standard.
This increase was mainly due to the continuing intense drought conditions throughout the year (resulting in increased dust storm activities) and the bushfire emergency October–December, elevating particle levels throughout the State in 2019.
Historically, annual average PM10 levels are generally higher in the Upper Hunter and the Port of Newcastle due to local industrial activity, than elsewhere in the State. Wagga Wagga North, in the South-west Slopes, is another station which typically records high PM10 annual averages, particularly during drought affected years due to windblown dust. In 2019, other regional town centres, such as Tamworth in the North-west Slopes, recorded similar or higher levels compared to the major population centres in the Hunter regions. This was due to the increasing effect of dust from the long-running drought, and significant bushfire impact in North-west Slopes in October and November. More information about particle levels in the Hunter regions can be found on the Hunter Valley page.
Daily average PM10 levels
Daily PM10 levels were over the standard at one or more metropolitan or regional population centres on 135 days in 2019 (compared with 64 days in 2018), excluding Stockton. There were an additional 29 days when daily PM10 were over the standard solely at Stockton. All 38 air quality monitoring sites in metropolitan and regional population centres recorded days with PM10 levels above the national standard in 2019. The high number of daily PM10 exceedances was mainly driven by the intense drought conditions, extensive bushfires throughout New South Wales from spring and the increasing frequency of widespread dust storms throughout the year. Hazard reduction burns around Sydney from April to August also contributed to particle levels in 2019.
The maximum daily PM10 level was 494.1 µg/m3, recorded on 31 December 2019 at the new Goulburn station (commenced on 6 November), due to a combination of smoke from bushfires throughout the day, and a widespread dust storm during the afternoon.
During the previous year in 2018, all stations also recorded days above the PM10 daily standard, however particle levels were lower throughout most of the network. The maximum daily PM10 concentration in 2018 was 274.1 µg/m3, recorded at Bathurst on 15 December 2018 during an extensive dust storm.
Other known causes of elevated PM10 particle levels are agricultural activities (such as stubble burning) at Wagga Wagga North and sea salt spray at Stockton (refer to figure below). In the Hunter Valley, local industrial sources also affect particle levels. More information on the special purpose industry-funded Hunter Valley monitoring networks is found in the Hunter Valley and Stockton.

Summary of PM10 observations in NSW for 2019, highlighting exceptional events that stood out.
Note: SW = South West, NW = North West, CC = Central Coast, CT = Central Tablelands, NT = Northern Tablelands, ST = Southern Tablelands.
Annual average values above the standard are shown as shaded bars with the values against applicable sites. Dotted shading shows levels above the annual average of 25 µg/m3.
na Annual average not reported (<75% of data available – PM10 data available at Rouse Hill from 27 May 2019 and Goulburn from 6 November 2019)
# Days above standard are divided into exceptional and non-exceptional events. Exceptional events are those related to bushfires, hazard reduction burns and continental-scale dust storms. These are not counted towards the NEPM goal of ‘no days above the particle standards in a year’.