National standards for PM2.5
- Annual average – 8 micrograms per cubic metre of air (8 µg/m3)
- Daily average – 25 micrograms per cubic metre of air (25 µg/m3)
Annual average PM2.5 levels
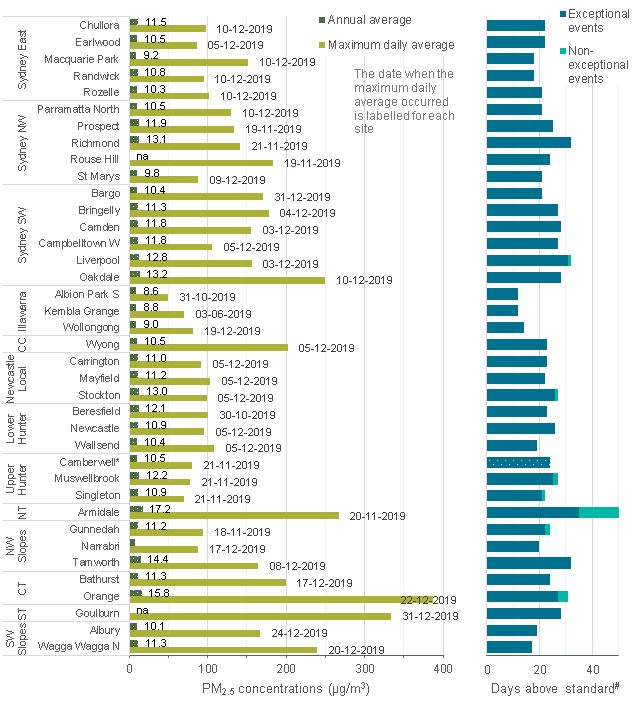
During 2019, 35 of the 36 sites with available annual average data in New South Wales recorded annual average PM2.5 levels above the national standard. PM2.5 annual average levels remained below the standard at Narrabri, in the North-west Slopes region.
Annual average PM2.5 levels ranged from 7.8 µg/m3 at Narrabri in the North-west Slopes to 17.2 µg/m3 at Armidale in the Northern Tablelands during 2019.
There was an increase in annual average PM2.5 concentrations and the number of sites exceeding the annual average standard in 2019, compared with 2018. In 2018, annual average PM2.5 levels ranged from 4.9 µg/m3 at Narrabri in the North-west Slopes region to 10.1 µg/m3 at Liverpool in Sydney South-west, with 16 of 33 sites above the annual average PM2.5 standard. The increase was mainly due to widespread bushfire smoke during the late spring to summer bushfire emergency period and the increase in particles throughout the State due to the continuing intense drought. Hazard reduction burns around Sydney from April to August also contributed to particle levels in 2019.
Daily average PM2.5 levels
Daily PM2.5 levels were over the standard at one or more metropolitan or regional population centres on 118 days in 2019 (compared with 52 days in 2018). All 37 NSW air quality monitoring sites in metropolitan and regional population centres, plus Camberwell, recorded daily PM2.5 levels above the national standard on at least 12 days each in 2019.
The most days above the PM2.5 daily standard were recorded at:
- Armidale (60 days) – due to bushfire smoke (35 days) and wood smoke from domestic heaters associated with cold calm nights with temperatures close to or below zero degrees (25 days)
- Liverpool (32 days) – due to bushfire smoke (24 days), hazard reduction burns (7 days) and wood smoke (1 day)
- Richmond (32 days) – due to bushfire smoke (27 days) and hazard reduction burns (5 days)
- Tamworth (32 days) – due to bushfire smoke.
- Orange (31 days) – due to bushfire smoke (25 days), widespread dust storm (1 day), hazard reduction burning (1 day) and wood smoke (4 days).
The maximum daily PM2.5 was 387.4 µg/m3, recorded at Orange on 22 December 2019, due to bushfire smoke.
In 2019, more stations recorded days above the PM2.5 daily standard and particle levels were higher, compared with 2018. In 2018, 23 stations recorded days above the PM2.5 daily standard and the maximum daily PM2.5 concentration was 123.8 µg/m3, recorded at Richmond on 25 April 2018 due to hazard reduction burns. The increase in 2019 was due to widespread smoke from bushfires burning around 4 million hectares in New South Wales from July to December 2019. Hazard reduction burns affected some days over the standard during the cooler months, however the number and scale of these was comparable to previous years.
Another known cause of elevated PM2.5 particle levels is smoke from domestic wood heaters. For example, the Upper Hunter Fine Particle Characterisation Study found that wood smoke was a major contributor to PM2.5 levels at Muswellbrook and Singleton in winter 2012.
Under the current NSW regulatory regime, wood smoke is managed largely by local government. Local councils have regulatory powers to control installation of wood heaters using their planning instruments. The NSW Environment Protection Authority (EPA) has been overseeing the existing regulatory framework and collaborating with stakeholders to improve wood heater emission and efficiency standards. The EPA has also developed a new suite of educational materials that councils can use to raise public awareness about wood smoke impacts and help wood heater owners to reduce particle pollution from their wood heaters.

2019 PM2.5 concentrations by location, with average and max levels, and days above standard.
Note: SW = South West, NW = North West, CC = Central Coast, CT = Central Tablelands, NT = Northern Tablelands, ST = Southern Tablelands.
Annual average values above the standard are shown as shaded bars with the values against applicable sites.
na Annual average not reported (<75% of data available – PM2.5 data available at Rouse Hill from 27 May 2019 and Goulburn from 6 November 2019)
# Days above standard are divided into exceptional and non-exceptional events. Exceptional events are those related to bushfires, hazard reduction burns and continental-scale dust storms. These are not counted towards the NEPM goal of ‘no days above the particle standards in a year’.
*Camberwell is an Upper Hunter Air Quality Monitoring Network small community monitoring station which is not suitable for assessing performance against NEPM standards, and therefore, events are not reported as exceptional or non-exceptional (see the Hunter Valley webpage).