Two Hunter Valley stations recorded the highest number of days over the PM10 particle daily benchmark in 2024 when comparing all stations across the broader NSW air quality monitoring network. These stations were Warkworth, a smaller community site station located near mining operations, and Stockton in Newcastle Local region, which is influenced by sea salt. These were the only 2 stations in New South Wales to exceed the PM10 annual benchmark.
Large population centres
Air quality data from monitoring stations near Hunter Valley’s larger population centres were analysed. This analysis includes stations:
- Beresfield, Newcastle and Wallsend in the Lower Hunter network
- Carrington, Mayfield and Stockton in the Newcastle Local network
- Aberdeen, Muswellbrook and Singleton in the Upper Hunter network.
The key findings for the above stations in 2024 were:
- The 8-hour average ozone level exceeded the national benchmark at Wallsend and Newcastle on 25 January during heatwave conditions.
- The PM10 daily benchmark was exceeded on 42 days, compared to 57 days in 2023. Excluding Stockton (which measures high levels of sea salt), the benchmark was exceeded on 6 days, comparable to 7 days in 2023.
- Like 2023, the PM2.5 daily benchmark exceeded at one station (Beresfield), and on one day (25 September). This was due to smoke from hazard reduction burning.
- The annual average benchmarks for both PM10 and PM2.5 particles were met at all population centre stations except Stockton.
For detailed particles data on the Hunter larger population centres, refer to the PM10 summary graph, and the PM2.5 summary graph on the Particles webpage. For Stockton, see below.
Stockton
Particle levels are often influenced by sea salt spray at Stockton, due to its proximity to the coast. This is particularly evident during the warmer months when onshore winds prevail. As a result of the unique influences on the Stockton station, further detail is provided in this section.
The key findings for the Stockton air quality monitoring station in 2024 were:
- Stockton met the national benchmarks and assessment goals for gaseous pollutants CO, NO2, SO2 and ammonia (NH3). The closest any gas level got to the benchmark was 62% for ammonia.
- There were 41 days when the daily PM10 levels exceeded the benchmark, compared to 54 days in 2023. The annual maximum level was 100.6 µg/m3, recorded on 12 February, due to sea salt aerosols.
- No days exceeded the daily PM2.5 benchmark, the same as 2023. The maximum level recorded was 24.4 µg/m3 on 25 September.
- Stockton exceeded the annual average benchmarks for both PM10 and PM2.5. The annual average PM10 was 32.9 µg/m3 and the annual average PM2.5 was 8.4 µg/m3.
Stockton PM10 pollution rose map
Pollution roses show the wind direction and their associated pollutant levels. The colours along the bars indicate categories of pollutant levels, with green shades showing the highest PM10 levels. The length of each bar shows the percentage of time the wind blows from a particular direction.
The Stockton PM10 pollution rose shows that the highest levels of PM10 particles at Stockton (shaded green) occurred under onshore north-easterly to south-easterly winds. These coastal winds, common in the warmer months, transport sea salt spray which increase levels of PM10 particles (Lower Hunter Particle Characterisation Study).
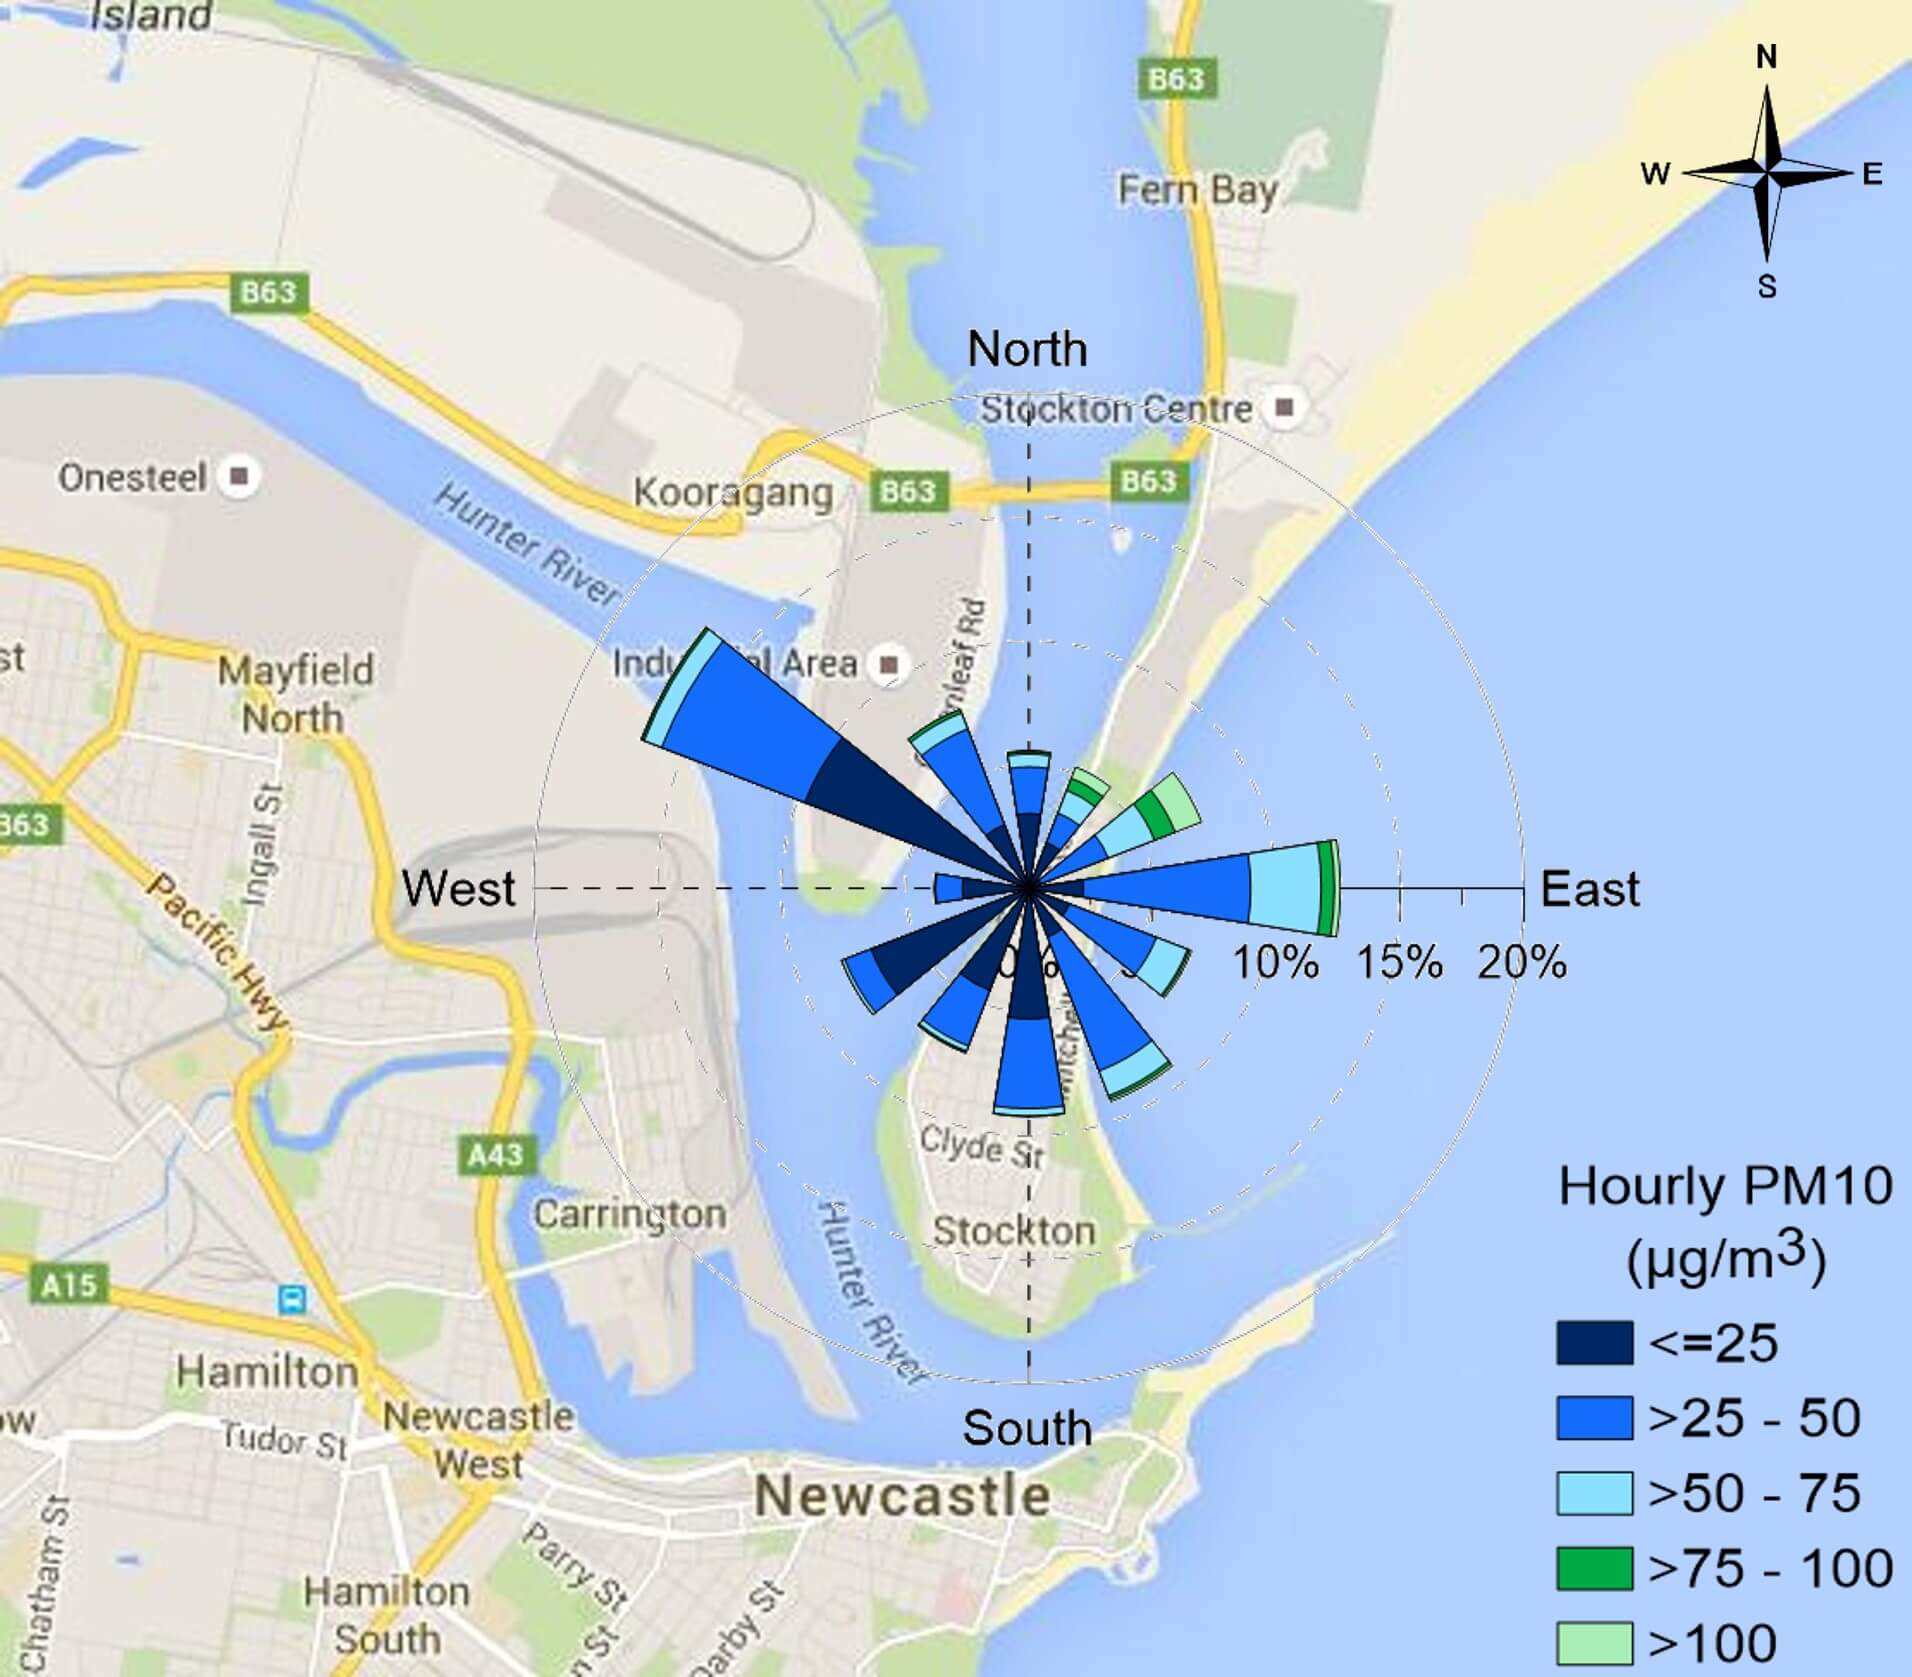
Stockton PM10 pollution rose map, 2024
Upper Hunter
Data for PM10 particles were analysed from all 14 air quality monitoring stations in the Upper Hunter Air Quality Monitoring Network as shown in the Upper Hunter PM10 summary graph below.
The key findings for 2024 were:
- There were 30 days when the daily PM10 level exceeded the benchmark at one or more stations, compared to 48 days in 2023.
- Warkworth recorded the highest number of days (25 days) where the daily PM10 level exceeded the benchmark, compared to 42 days in 2023.
- The highest daily PM10 level was recorded at Camberwell on 2 September (166 µg/m3), due to local dust.
- All stations except Warkworth met the annual average benchmark for PM10.
- A regional dust event on 4 February saw 6 air quality monitoring stations exceeding the PM10 benchmark.
Upper Hunter PM10 summary graph
The bar chart shows the maximum PM10 daily averages (left), PM10 annual averages (centre), and days exceeding the PM10 benchmark (right), for each of the 14 stations in the Upper Hunter.
Exceedance days have not been divided into exceptional and non-exceptional events, as the NEPM compliance goals are not applied to these smaller community, diagnostic or background stations.
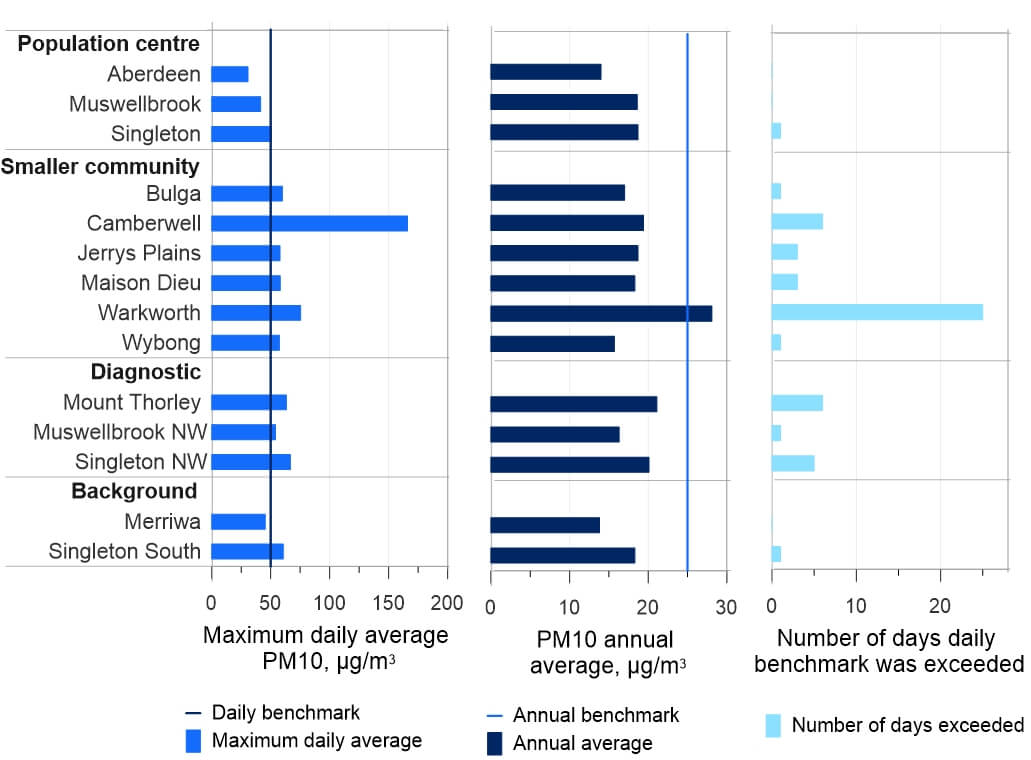
Upper Hunter PM10 summary, 2024
More information
- Air quality monitoring in the Lower Hunter and on the Central Coast
- Air quality monitoring in the Upper Hunter
- Current air quality in Lower Hunteropens a new window
- Current air quality in Upper Hunteropens a new window
- Lower Hunter Particle Characterisation Study
- Newcastle and Central Coast air quality monitoring reports
- Upper Hunter air quality monitoring reports