We measure and model waves as they travel from deep ocean waters to the coast.
The shape of the seabed influences waves as they approach the coast. Wave conditions at one beach may be very different from the next, even at the same time.
Waves move sand along the coast where it is continuously recycled between the surf zone and the beach–dune system. High waves and raised water levels, or storm surges, can erode sand from beaches and expose dunes and coastal structures to wave impact.
Calmer waves move sand back onshore and replenish beaches, which can take several months to years.
Coastal buoys
Our coastal and marine scientists deploy temporary wave buoys in shallow coastal waters to measure waves shortly before they break at the coast. The data the buoys collect is used to model wave and sand transport processes and study coastal hazards.
Live data from wave buoys is available on our Sharing and Enabling Environmental Data (SEED) portal.
Go to our Nearshore wave buoy data page on the SEED portal to watch a video about how to view and download our live wave data. Data packages from completed wave buoy deployments can also be downloaded.
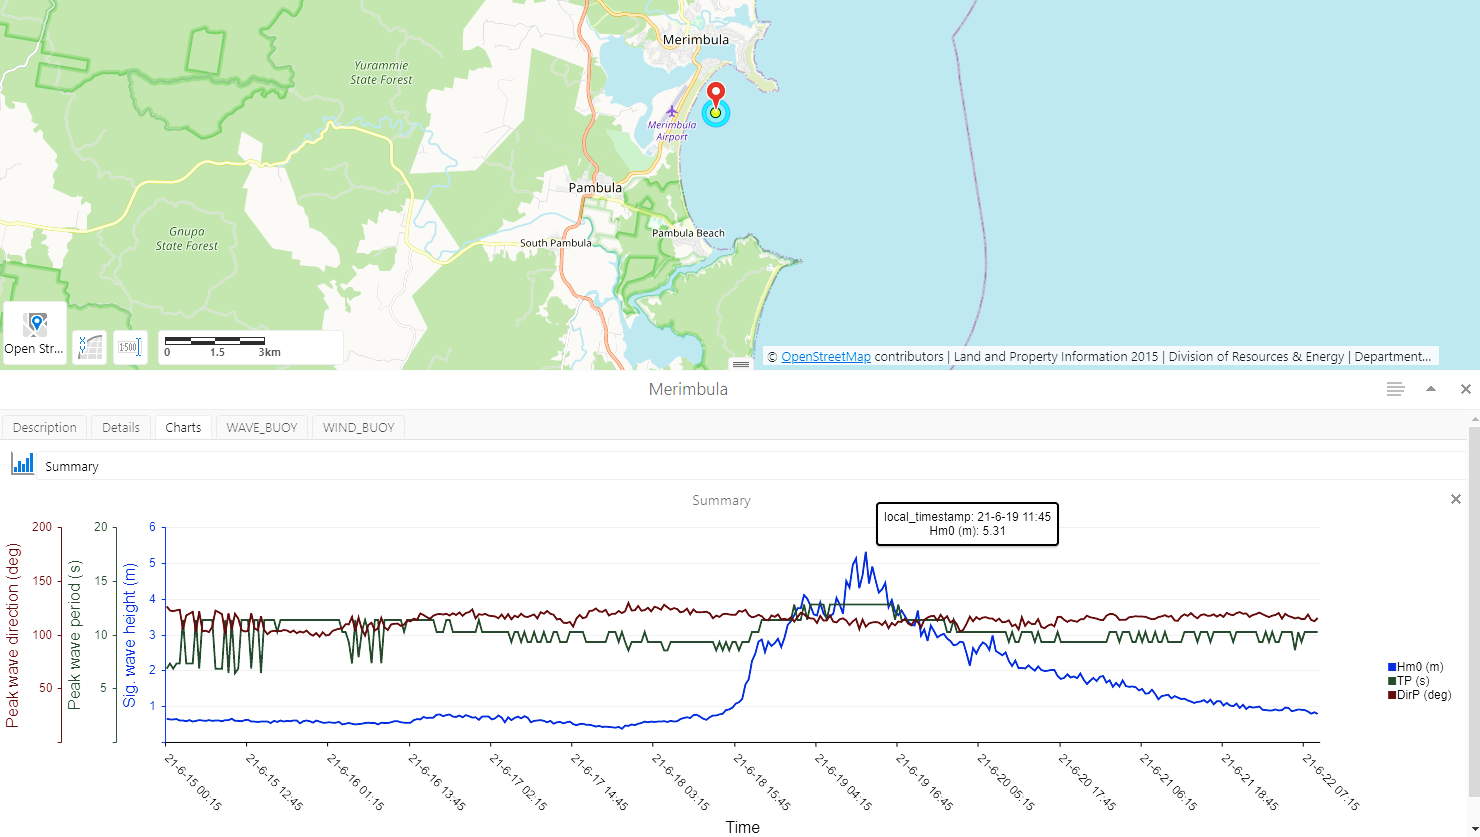
SEED portal showing the location of a mini-wave rider buoy deployed near Merimbula on the Far South Coast (top), and a 7-day plot of hourly wave height, period and direction (bottom)
Ocean wave buoys
We also manage the NSW Coastal Data Network Program, which includes 7 long-term offshore wave buoys operated by Manly Hydraulics Laboratory. These buoys collect long-term wave data, which helps us understand regional wave climates and extreme conditions.
The ocean wave data are used for maritime safety, recreational activities, and coastal management and planning by scientists, engineers, government agencies, including the Bureau of Meteorology, and the public. The data contributes to a national archive of wave data supported by the Integrated Marine Observing System and made available via the Australian Oceanographic Data Network Portal.
Wave modelling
The NSW Coastal Ocean Wave Model and Nearshore Wave Transformation Tools simulate coastal wave conditions at over 14,000 locations along the coast using data from offshore wave buoys and global climate models.
The wave modelling tools provide local wave data for investigating coastal hazard issues and support local governments to develop coastal management programs.
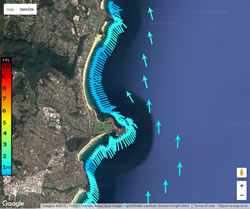
Low southerly wave conditions in Sydney 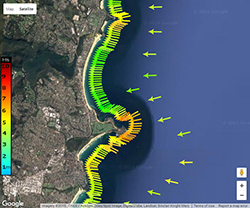
High easterly wave conditions in Sydney
The NSW Nearshore Wave Forecast provides a rolling 12-day window of nearshore wave conditions at depths of 10- and 30-metres along the entire NSW coastline. We develop this forecast using the:
- Nearshore Wave Transformation Tools
- ocean wave data from the offshore wave buoy network
- Bureau of Meteorology’s AUSWAVE forecast.
Figure Eight Pools
Wave risk forecast
The Figure Eight Pools is a uniquely shaped rock pool located on a rock shelf in the Royal National Park. Even at low tide waves can wash over the rock platform and take visitors by surprise.
In collaboration with the Sydney Institute of Marine Science, we deployed a nearshore wave buoy near the site to study how local wave conditions and tides combine to allow ocean waves to wash over the rock platform.
The data collected by the buoy is used to produce a wave risk forecast, which translates complex wave and tide data into a simple risk rating for each hour of the day over the next 4 days. The risk ratings enable visitors to plan ahead and visit only during low-risk conditions and avoid high- and extreme-risk conditions.
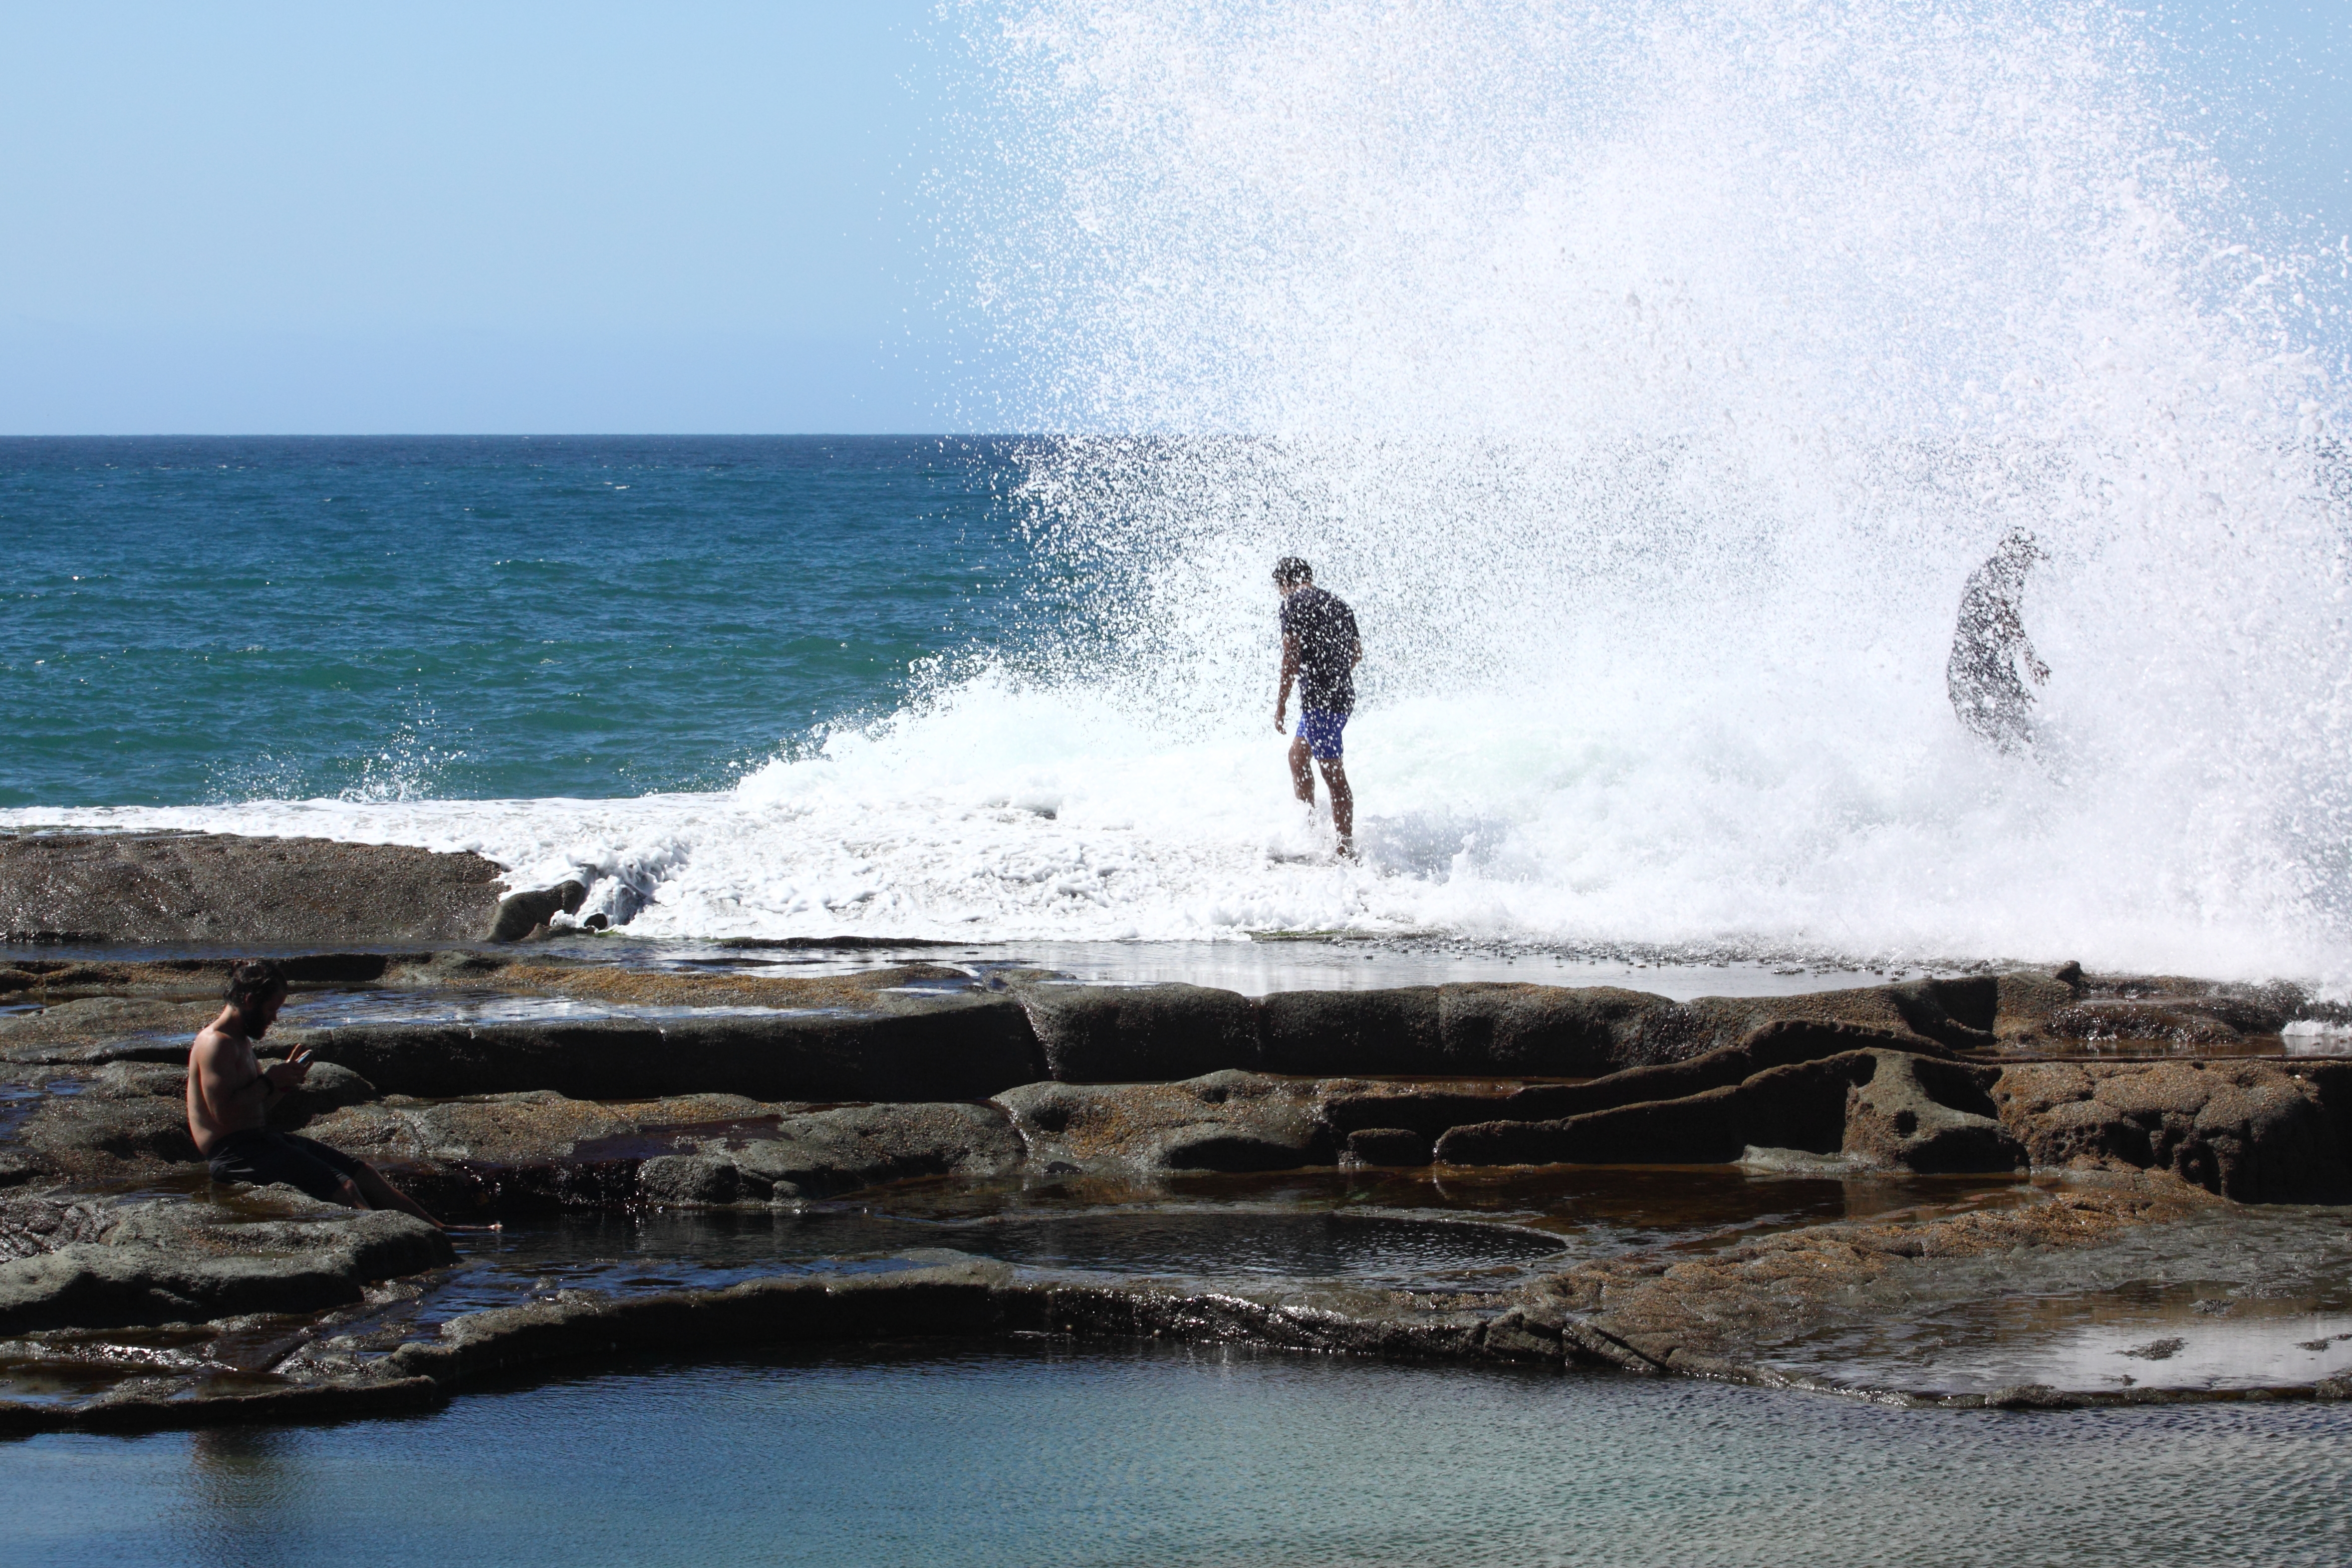
Visitors surprised by a large wave at Figure Eight Pools, Royal National Park
Videos
Watch this video about wave buoy deployment in action.
Watch this video about the science behind the Figure Eight Pools wave risk forecast.