The Stockton air quality monitoring station is part of the industry-funded Newcastle Local Air Quality Monitoring Network, located in the Port of Newcastle. Due to the proximity of industrial sources, the national ambient air quality standards do not apply directly to the data collected at this monitoring station. However, the government recognises the community's interest in knowing how air pollution levels at the station compares against the standards. Therefore, this section refers to national standards as national benchmarks when evaluating air quality data throughout Stockton.
The Stockton station is approximately 300 metres from the ocean and 20 metres from the Hunter River. Due to its proximity to the coast, high PM10 particle levels recorded at Stockton most often occur under onshore easterly winds. The Lower Hunter Particle Characterisation Study found that sea salt had the largest contribution to PM10 at Stockton. This typically also results in Stockton recording the most days exceeding the PM10 benchmark across the NSW Air Quality Monitoring Network metropolitan and rural centres.
Stockton particles and ammonia
Daily PM10 particle levels at Stockton were over the national benchmark of 50 µg/m3 on 37 days in 2022, compared with 24 days in 2021, with sea salt found to be the main contributor (see Contributors to exceedances at Stockton table).
The PM10 annual average at Stockton reached 30.3 µg/m3 in 2022, compared to 30.1 µg/m3 in 2021, which was the highest in New South Wales and the only annual record exceeding the national benchmark of 25 µg/m3. The annual averages in 2021 and 2022 were the 2 lowest recorded in the 8 years of operation since 2015.
Of the 37 days exceeding the PM10 benchmark, 34 days or 92%, occurred in the warmer months of January to March and October to December, when onshore winds typically prevail, and sea salt contribution increases. The remaining 3 days occurred during April and September when transitioning from and to warm conditions.
There were no daily PM2.5 particle levels over the national benchmark of 25 µg/m3 at Stockton in 2022, similar to 2021.
The PM2.5 annual average was within the national benchmark of 8 µg/m3, with a level of 7.5 µg/m3, compared to 8.3 µg/m3 in 2021. This was the lowest PM2.5 annual average at Stockton since operations began in 2015.
Hourly ammonia (NH3) levels were within the assessment goal of 46 pphm at Stockton throughout 2022. The maximum hourly NH3 level was 38.2 pphm, recorded on 16 June 2022, compared to 35.8 pphm in 2021. The annual average ammonia level was 1.2 pphm, compared to 1.4 pphm in 2021.
Contributors to particle exceedances at Stockton (2022)*
| Main source | PM10 | PM2.5 |
|---|---|---|
| Sea salt | 37 | 0 |
| Bushfire | 0 | 0 |
| Regional dust | 0 | 0 |
| Local dust | 0 | 0 |
| Industry | 0 | 0 |
| Hazard reduction burning | 0 | 0 |
| Woodsmoke | 0 | 0 |
| Agricultural burning | 0 | 0 |
| Widespread dust storm | 0 | 0 |
* Note: The main source contributions are determined using existing information base, including scientific literature, source information, and the prevailing meteorological conditions, rather than chemical analysis on each day. It is possible there are minor contributions from other sources, however, the evidence base indicates these are the main contributors.
Stockton pollution roses
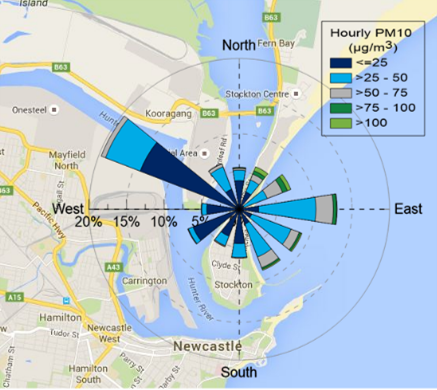
The Stockton PM10 pollution rose shows that higher PM10 levels are primarily recorded during onshore north-easterly to south-easterly winds (see Stockton pollution roses).
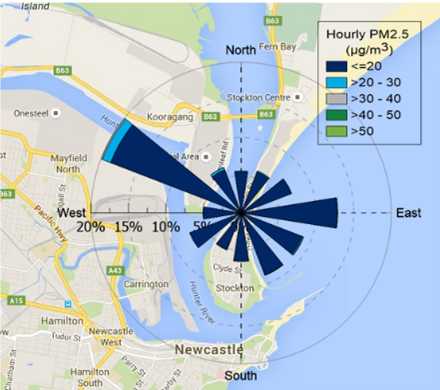
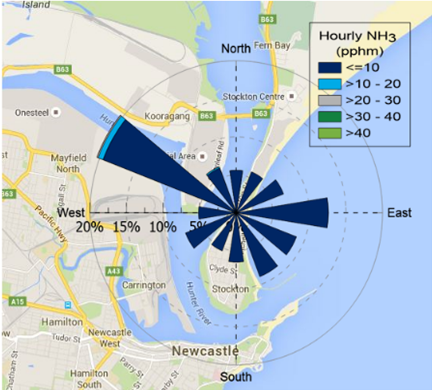
The Stockton PM2.5 and NH3 pollution roses show that hourly PM2.5 and NH3 levels remained low throughout the year at Stockton.
For more information on seasonal air quality at Stockton, refer to the Newcastle seasonal air quality monitoring newsletters.
Stockton pollution roses
Pollution roses of hourly PM10, PM2.5 and ammonia (NH3) for 2022 at Stockton. Pollution roses show the wind direction and pollutant levels. The length of each bar around the circle shows the percentage of time the wind blows from a particular direction. The colours along the bars indicate categories of pollutant levels. Higher average concentrations are shown in light green, whereas lower concentrations are shown in dark blue.


